
Stocks fell yesterday because there was literally no good news to be found in a sea of worry. Well, maybe there was some good news, but it would have taken too much imagination to convert it to gains.
Grounded. If you didn’t read my report yesterday, the session would have appeared to be another one of those boring, painful slogs which saw a market opening deep in the red, gasping for air, trying but not succeeding to get out of the hole. What, you didn’t read it? Ok, here is what I said in a nutshell. The median and mean of 70 blue chip economists expected Q1 Gross Domestic Product / GDP to come in at +2.19%. At the low, low end was an analyst that expected GDP to come in at +0.8%, while juggernaut Goldman Sachs was just below the high end with expectations of +3.1%. That’s the nutshell 🥜.
Well, as it turns out, the negative Nancys turned out to be correct when the actual number came in at just +1.6%, which was more than 1 standard deviation below the expected number. In English, that means that the actual number came in below a zone which encompassed 68% of the projections of the top Wall Street economists, or, even more plainly, it came in where a minority of just 16% of them were. Now, that is not precision math, but rules of thumb can be applied, and I hope you get the picture that it was a negative surprise.
So, what does this negative surprise mean. Well, first, let’s see where the surprise may have come from. The easiest way to see that is to look at the chart of GDPs components (my favorite Bloomberg chart of all time). Have a look and follow me to the finish.
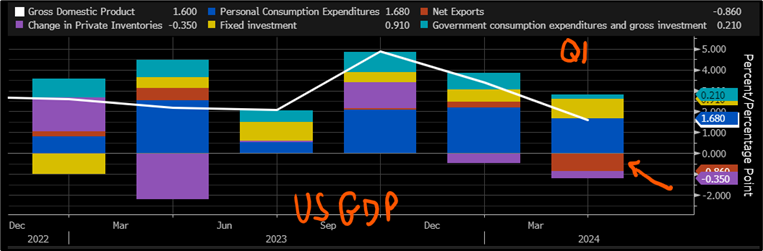
Looking at the stacked bar all the way to right, you will notice that the rust-colored bar was far below the 0% line, which is certainly a drag on the overall GDP figure relative to the prior 5 quarters that appear on this chart. That rust-colored tier represents net exports, which is literally total export – total imports. When the US exports products and services, money flows in and increases GDP. Conversely, when the US imports goods and services, money flows out and decreases GDP. Last quarter, more flowed out than in. There are many ways to interpret that, but generally speaking, VERY generally, large decreases in net exports occur when the US economy is doing well; higher demand for imported products 🚗🚗👜👜👗👗. Ok, so that is not a new anomaly. The real focus on yesterday’s number was the blue and gold tiers, or Personal Consumption Expenditures and Fixed Investment. Consumption makes up 2/3 the weight of GDP and it is also a key inflation driver. That number was smaller than the print in Q423. Breaking it down into Goods and Services, we note that Goods growth slowed in the quarter, so the entire gain was caused by services. Please don’t tell me that you are surprised. Still, an overall lower PCE number is friendly to inflation. Getting to Fixed Investment, the gold tier, we can see that it had a larger positive influence on GDP than in the prior quarter. This is considered inflationary as the aggregate represents nearly 20% of GDP. Drilling down on this category, we can see a very large, AND GROWING, contributor was Residential Structures, driven by Single Family. If you read Wednesday’s report Comforts of Home (https://www.siebert.com/blog/2024/04/24/tesla-electrifies-traders-with-promises-of-a-cheap-car-soon/), you would not be surprised, either.
So, the net of things is that GDP came in lower than expected, which can be negative, if you believe in a strong economy – I DO. If you are worried about finding signs of inflation which would cause the Fed to slow down its rate cuts, you might have found the larger Fixed Investment category attributed to housing to be of concern. A +6 basis-point increase in 10-year Treasury Note yields in yesterday’s session can give you a clue of what the market’s took away… inflation fear / less rate cuts. Oh, and it did not help that the quarterly PCE Price Index which comes along with the GDP series came in hotter than expected. This morning’s PCE deflator is a monthly number and will be closely watched by the same folks that ran for cover yesterday. Pay attention.
WHAT’S UP IN THE PREMARKET
Alphabet Inc (GOOG / GOOGA) shares are higher by +11.58% in the premarket after the company posted positive surprises in both EPS and Revenues. The company attributes the blowout numbers to AI increasing gains in its cloud computing business. Additionally, the board approved a cash dividend… investors like dividends. Projected dividend yield: 0.51%. Potential average analyst target upside: +19.9%.
Microsoft (MSFT) shares are higher by +4.26% in the premarket after it announced that it beat EPS and Revenues by +3.87% and +1.62% respectively. The company attributes the gains to growth in its AI-driven businesses. In the past month 17 analysts have raised their price targets while 3 have lowered them. Dividend yield: 0.75%. Potential average analyst target upside: +20.0%.
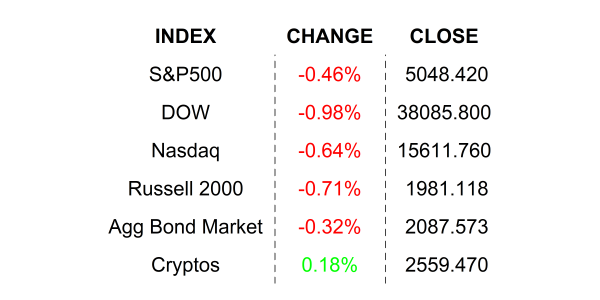
YESTERDAY’S MARKETS
NEXT UP
- Personal Income (March) is expected to have grown by +0.5% after increasing by +0.3% in the prior month.
- Personal Spending (March) may have increased by +0.6% compared to a larger gain of +0.8% in February.
- PCE Core Deflator YoY (March) is expected to have slowed to +2.7% from +2.8%.
- Next week: lots more earnings along with more housing numbers, Consumer Confidence, JOLTS Job Openings, ISM Manufacturing / Services, and to top things off, we have an FOMC meeting mid-week and the monthly employment numbers on Friday. It willbe a busy week for sure, you would be wise to check back in on Monday and download the weekly calendars for details.
IMPORTANT DISCLOSURES.
Muriel Siebert & Co., LLC is an affiliated broker/dealer of the public holding company, Siebert Financial Corporation, which also owns Siebert AdvisorNXT, LLC. Siebert AdvisorNXT, LLC is a registered investments advisor (RIA) with the SEC and with state securities regulators. We may only transact business or render personal investment advice in states where we are registered, filed notice or otherwise excluded or exempted from registration requirements. Investment Advisor products are NOT insured by the FDIC, SIPC any federal government agency or Siebert’s parent company or affiliates.
You are being provided this Market Note for general informational purposes only. It is not intended to predict or guarantee the future performance of any security, market sector or the markets generally. This Market Note does not describe our investment services, recommendations or market timing nor does it constitute an offer to sell or any solicitation to buy. All investors are advised to conduct their own independent research before making a purchase decision. This Market Note is to provide general investment education and you are solely responsible for determining whether any investment, security or strategy, or any other product or service, is appropriate for you based on certain investment objectives and financial situation. Do not use the information contained in this email as a basis for investment decisions. You should always consult your investment advisor and tax professional regarding your investment situation before investing. The charts and graphs are obtained from sources believed to be reliable however Siebert AdvisorNXT does not warrant or guarantee the accuracy of the information. Any retransmission, dissemination or other use of this email is prohibited. If you are not the intended recipient, delete the email from your system and contact the sender. This is a market commentary, not research under FINRA Rule 2210 (b)(1)(D)(iii) and FINRA Rule 2210 (c)(7)(C).
© 2021 Siebert AdvisorNXT All rights reserved.
