
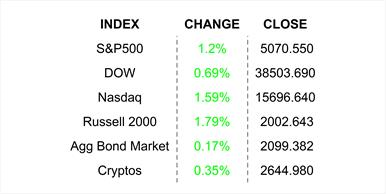
Stocks rallied for a second straight day, propped up by upbeat earnings. Manufacturing and services PMIs stalled in the US according to the latest flash releases – both are on the brink of contraction.
Comforts of home. Do you own a home? If you do, I am sure that you have noticed… NOT THAT YOU’RE LOOKING… that the value of your home has edged higher in the past few years. Are you in the market for a home? If you are, I am sure that you have noticed that prices seem… um, a bit rich. If you can resonate with either of these two categories, your hunch is probably correct… well, it is actually correct. Check out this chart.
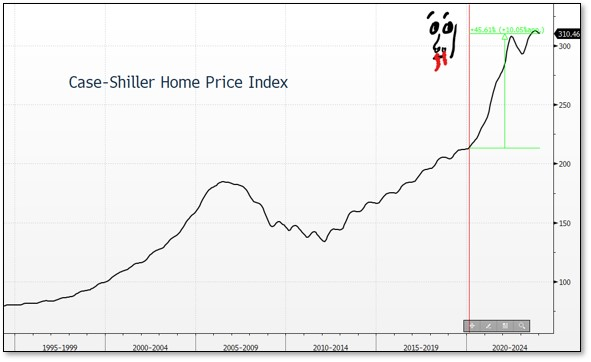
You can see by this Home Price Index chart that prices have indeed climbed. The red horizontal line marks the general start of the pandemic in March 2020, and you can see that the index has risen by some +45% since then. Remember this is an index based on national average, you may observe higher or lower numbers based on where you live. So how did we get to these nosebleed levels? Well, experts tell us that the problem is with inventory. When the pandemic started, most folks already in homes hunkered down. If their homes were on the market, they quickly pulled them off. At that point, demand in suburban areas picked up as city dwellers rushed to find more space and grass… for their pets. The increase in demand combined with the decrease in supply caused prices to spike as bidding wars erupted. Higher home values on paper were great for the egos of homeowners, but they were a double-edged sword. Sure, they could sell into a rich market, but they would have to pay up for their next homes as well, and with very little supply, the choices were limited. This situation only caused existing homeowners to become more entrenched, keeping supply tight. What could possibly stop rising home prices?
Well, the Fed did its best to hamper home demand by ratcheting up interest rates. That served to pump mortgage rates up to over 8% last year from just below 3% where they were in 2021. As you can see from the far right-hand side of the chart, the move did have an effect, albeit a minor one. Further, the decline was only temporary. So here we are with reduced supply and even higher finance costs haven’t been able to cause prices to moderate.
Hmm, if there were only some way to increase supply… LIGHTBULB 💡💡💡. That’s it… build new homes… lots of them. Guess what, we have a chart for that. Check it out, then follow me to the finish.

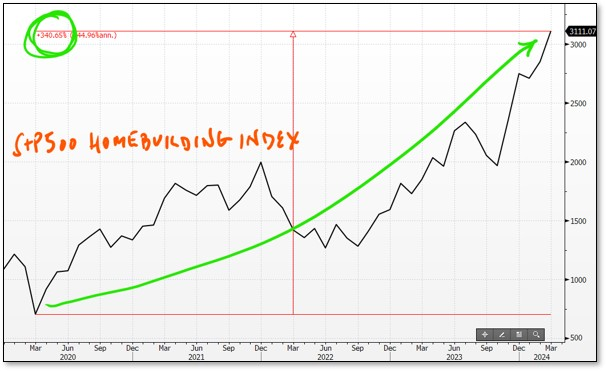
There is a lot on this chart. First, you will notice that we are now at levels not seen since 2008. Second, you can see how the rise in inventory increased in intensity after the pandemic began. Finally, you can see how inventory decreased… em, temporarily in 2022. So, what does this all mean. Well, increased supply, according to my microeconomics professors, should serve to keep price inflation in check. If we look at the first chart up above, though it is quite minimal, we can see at the far, far right a slight moderation. “But will it continue,” you assert astutely. And then you remember that yesterday morning, the Census Bureau reported that New Home Sales jumped by +8.8% in March, while economists were only expecting a +0.9% gain. If strong demand like that continues, the reply to your assertion, is “probably not for long.” Because I know that my readers are smart, and generally highly caffeinated, I will leave you with a bonus chart of the S&P500 Homebuilding Index, so you can see how the companies that build those new homes have fared since the pandemic. Are you surprised? Of course, you’re not, it’s economics.
WHAT’S BUILDING IN THE PREMARKET
Tesla Inc (TSLA) shares are higher by +12.63% in the premarket after the company announced a wide miss on EPS and Revenues. The company announced that it is redoubling its efforts to bring its long-awaited, low-cost model to the market. In the past month, 27 analysts have lowered their price targets while none has increased them. Potential average analyst target upside: +25.8%.
Enphase Energy Inc (ENPH) shares are lower by -9.01% in the premarket after it announced that it missed EPS and Revenue estimates by -16.38% and -5.26% respectively. The company also provided Q2 guidance that was below analysts’ estimates. Potential average analyst target upside: +12.4%.
Also, this morning: Owens Corning, Thermo Fisher Scientific, Hilton Worldwide, Virtu Financial, Hasbro, Boston Scientific, Wabco, Humana, Stifel, and Boeing all beat on EPS and Revenues while Lithia Motors, Synchrony Financial, AT&T, Watsco, Bunge, Old Dominion Freight, Otis Worldwide, Biogen, and General Dynamics missed the mark.
YESTERDAY’S MARKETS
NEXT UP
- Durable Goods Orders (March) are expected to have increased by +2.5% after climbing by +1.3% in February.
- Earnings after the closing bell: Whirlpool, Ford, Chipotle, O’reilly Automotive, IBM, Molina Healthcare, United Rentals, ServiceNow, Lam Research, Annaly Capital Management, Waste Management, Align Technology, Meta, Knight-Swift, and Raymond James.
IMPORTANT DISCLOSURES.
Muriel Siebert & Co., LLC is an affiliated broker/dealer of the public holding company, Siebert Financial Corporation, which also owns Siebert AdvisorNXT, LLC. Siebert AdvisorNXT, LLC is a registered investments advisor (RIA) with the SEC and with state securities regulators. We may only transact business or render personal investment advice in states where we are registered, filed notice or otherwise excluded or exempted from registration requirements. Investment Advisor products are NOT insured by the FDIC, SIPC any federal government agency or Siebert’s parent company or affiliates.
You are being provided this Market Note for general informational purposes only. It is not intended to predict or guarantee the future performance of any security, market sector or the markets generally. This Market Note does not describe our investment services, recommendations or market timing nor does it constitute an offer to sell or any solicitation to buy. All investors are advised to conduct their own independent research before making a purchase decision. This Market Note is to provide general investment education and you are solely responsible for determining whether any investment, security or strategy, or any other product or service, is appropriate for you based on certain investment objectives and financial situation. Do not use the information contained in this email as a basis for investment decisions. You should always consult your investment advisor and tax professional regarding your investment situation before investing. The charts and graphs are obtained from sources believed to be reliable however Siebert AdvisorNXT does not warrant or guarantee the accuracy of the information. Any retransmission, dissemination or other use of this email is prohibited. If you are not the intended recipient, delete the email from your system and contact the sender. This is a market commentary, not research under FINRA Rule 2210 (b)(1)(D)(iii) and FINRA Rule 2210 (c)(7)(C).
© 2021 Siebert AdvisorNXT All rights reserved.
