

This was the year which had the deck stacked against investors of all types. I hate to start out with an idiom, but I cannot think of a better way to describe the setup for 2022. Not including this, the 10 years prior have been good ones. Only 2 losing years for stocks with all but 1 winning year above the long-term average. For bonds, the picture was bright as well, with only 2 losing years in the past 10! “Wait,” you exclaim, “aren’t bonds supposed to win always?!” I know that you know better than that, there are no sure bets when it comes to investing. That said, bonds have been in somewhat of a bull market since the 70s. Wanna give a guess on how many losing years the bond market has had since 1976? Would you look at me funny if I told you that you could count them on one hand? That’s right, only 4 times, 1994, 1999, 2013, and 2021. The biggest loss in one year was -2.02%. Seems like a safe investment, right? How about growth stocks? You know those stocks that we have all come to love? The ones that have literally branded millionaires and, in some cases, billionaires. You know which ones I am talking about. Stocks like Apple, Microsoft, Amazon.com, Facebook-now-Meta, Google-now-Alphabet, Adobe… need I go on? Those are just some of our favorite growth stocks. Why are growth stocks so beloved by one and all? Because they always seem to go up. Wait, they do almost always go up! In the 10 years leading up to this one, the S&P500 Growth Index gained in every year except 2018. In 2018 it only lost -1.39%. Its best 2 years through that period were 2020 and last year in which the index returned +31.99% and +31.04% respectively. If you have already forgotten, the world was frozen shut with a deadly pandemic during those years. Now that the worst appears to be behind us, 2022 should have been another one for the records books. It certainly was!
COVID-19
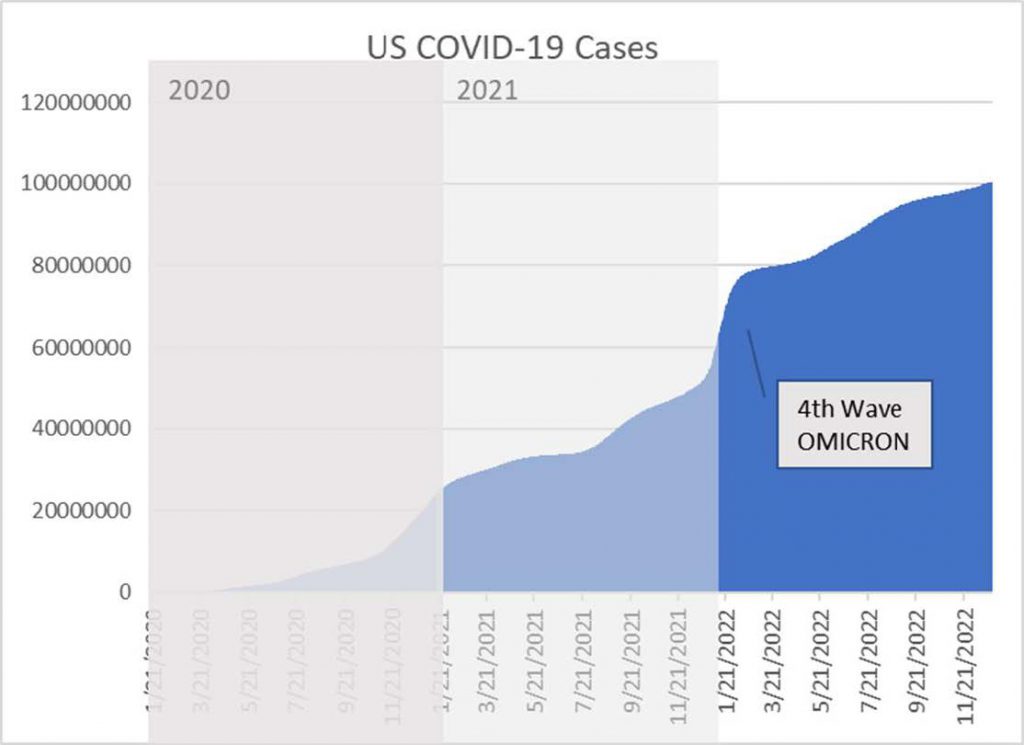
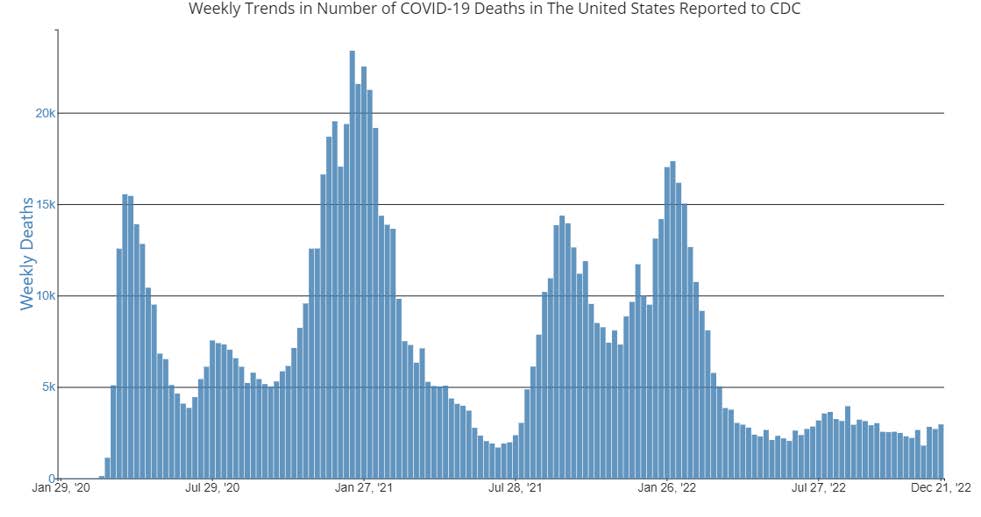
You may be wondering why I am starting with COVID-19? Well, I started last years year-end report with news on the pandemic. COVID-19 is still very much a thing in the world; however, the news feeds rarely featured them in the past year, other than in relation to China. The 2 charts below explain why we have heard so little of COVID in the financial press. The year just ended, 2022, started with a steep rise in COVID cases representing the back end of the 4th wave of the OMICRON variant. That ended with the close of Q1, what is most notable is that COVID-related weekly deaths appear to have stabilized in the final 3 quarters of the year.
Here is where things get interesting. If we turn our sites abroad to China, the COVID view changes drastically.
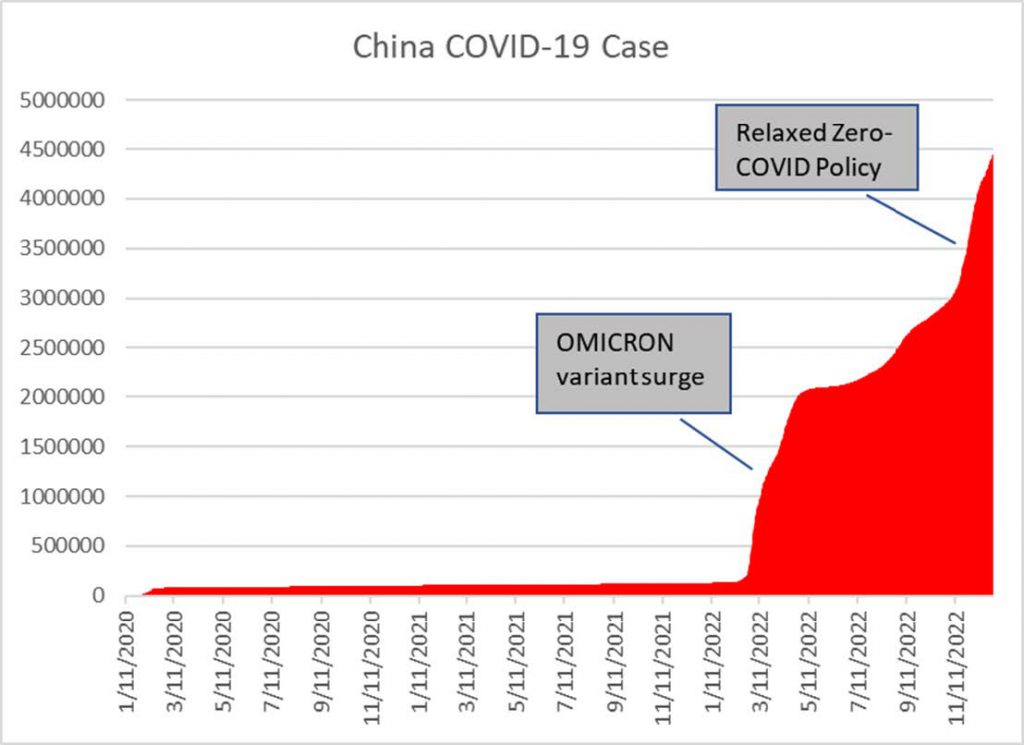
The Zero-COVID Policy practiced in China got a lot of press in the final months of 2022 as the Government under intense scrutiny, relaxed its restrictive policies. What is not commonly known is that China began the practice in 2020 and was able to contain the virus up until the OMICRON surge that started in Q2 of 2022. The lockdowns that followed took a toll on the US equity markets as so many manufacturers rely on components fabricated in China. Lockdowns meant more friction in an already gummed up supply chain. The lockdowns also had an effect on the Chinese economy which was itself still recovering from the initial onset of the pandemic. The weaker Chinese economy sent shockwaves through raw materials commodity markets, as China is one of the largest consumers of raw materials such as industrial raw metals and crude oil. Those markets were already volatile and strained as the rest of the world sprang back to life in 2021 and beyond.
War in Ukraine
As we rang in 2022 news reports began to surface about Russian troop buildups on the border of Ukraine. Though the topic was not at the top of the press tape, rhetoric between Russia, the US, and NATO was
already flying in December of 2021. As such there were no major implications on market behavior. Soon, though we began to learn of fortification buildups on Ukraine’s border with Belarus, a Russian ally. By the end of January, Russian military “exercises” were taking place near the Ukrainian border which led up to a 10-day joint military exercise with Belarus which began on February 10th. January saw the equity market sputter. While geopolitics was certainly a factor, traders were more focused on Federal Reserve rate-hiking rhetoric than eastern European politics. Besides, “why would Vladimir Putin invade Ukraine,” quipped stock traders?
Energy prices
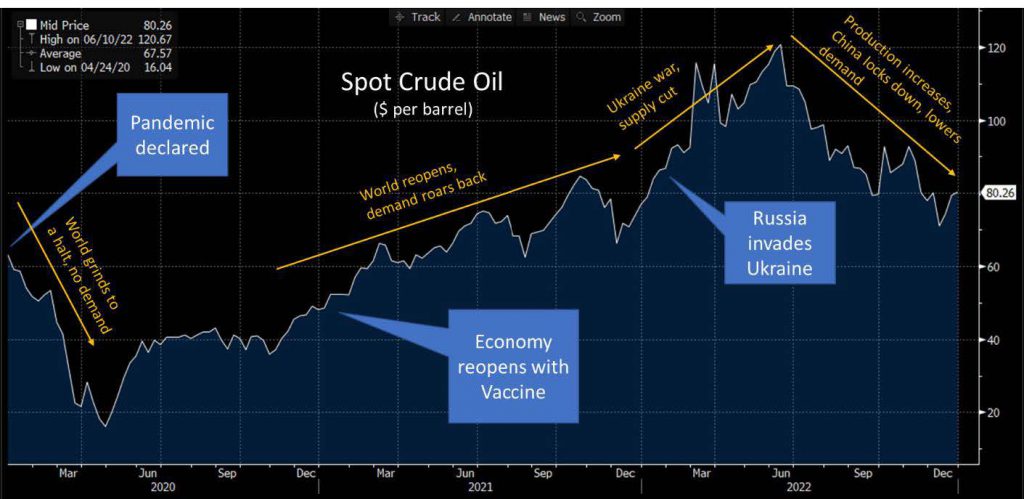
Energy traders began responding to the escalation by pushing up crude prices reaching the $70s by the end of January, a level which was not reached in earnest since 2014. For reference, crude was trading in the $50s / per barrel just prior to the pandemic. The following chart details crude oil prices from just prior to the pandemic through the end of 2022. You will note how crude prices grew rapidly through 2021 as demand increased with the reopening of the economy. Industry came back while cars and jets began to return to road and sea. The onset of the war in Ukraine would mean supply cuts from the world’s 3rd largest producer, causing crude prices to hit fresh highs. By March, crude would trade over $100 / barrel and remain there through June. Global supply increases and supply stabilization from Russian imports put pressure on crude prices in the summer, while China began locking down cities under its Zero-COVID policy, reducing industrial demand for crude.

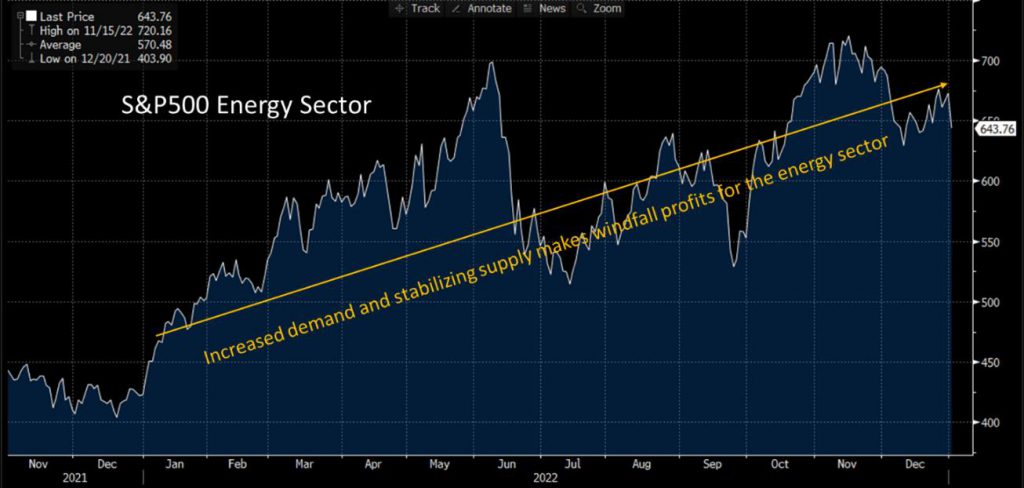
There were implications for the steep rise in crude oil prices. There were positive and negative ones. The positive was on the once-struggling energy sector, which was perpetually in the worst producing sectors group for years prior to the pandemic. 2022 would prove to be a landmark year for the sector as price volatility of supply and increased demand would enable the energy companies to attain record growth and high margins.
Gas prices
The negative implication for the volatility could be found in rapidly rising fuel costs. The economic reopening meant commuters returning to the roads, trucks back on the pike, planes to the air, and ships back on the high seas.
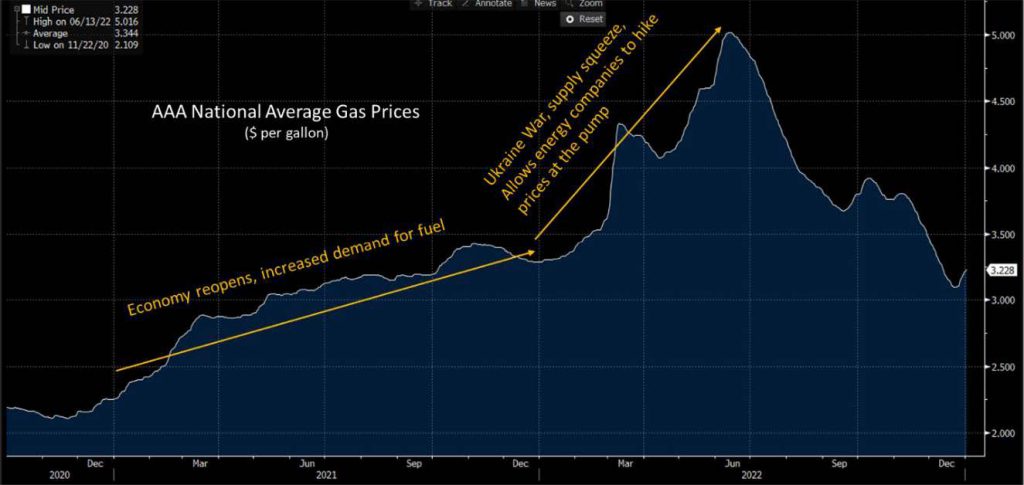
As one notes from the chart above, average gas prices topped off over $5 / per gallon on average, and for the record, that is the highest cost since AAA began tracking them in 2004. The rapid rise in fuel cost not only impacted budgets of average consumers but also on shipping costs, driving manufacturers to raise prices of goods. All this served to have a direct impact on general inflation. More on that in a bit, but there were other implications of the Ukraine war as well.
Agriculture
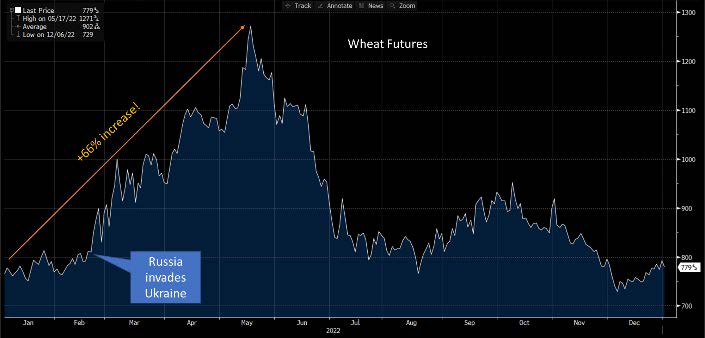
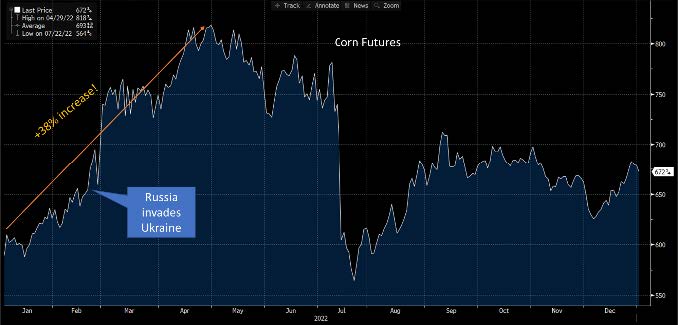
Prior to Russia’s invasion of Ukraine, many average investors would not have guessed the region’s impact on the world’s grain supply. Russia is the largest wheat exporter in the world while Ukraine is the 5th largest. Ukraine is the 6th largest exporter of corn in the world. Not only is corn used in producing many food products for human consumption, but it is also used in livestock feed. Supply disruptions and embargoes caused corn and wheat prices to rise around the globe. While other countries like the US are capable of filling supply shortfalls, prices are set globally. These rises therefore had a direct impact on food items across the board.
The plot thickens yet further. In order for farmers to grow these items, indeed, most farm-grown products need fertilizer. A key ingredient in fertilizer is potash.
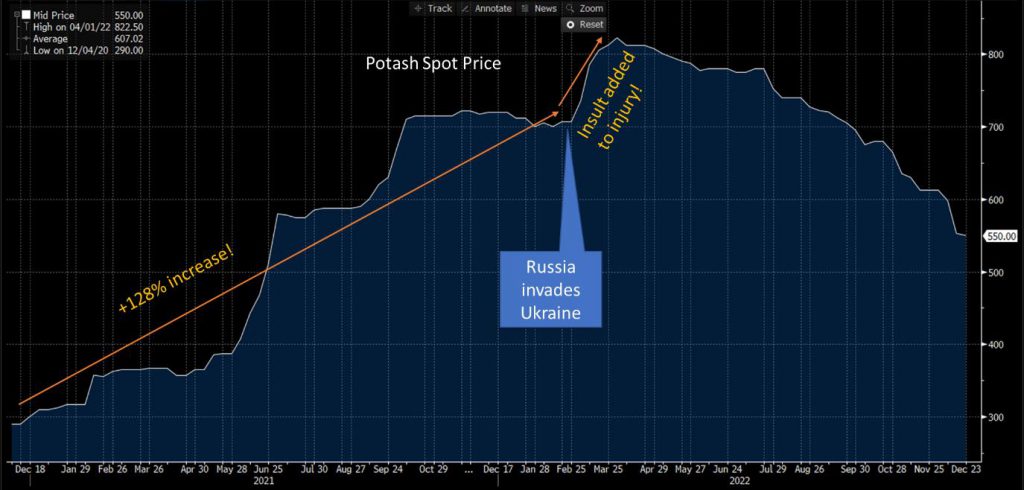
What is probably clear by the charts above, is that the war in Ukraine had an impact on already rising inflation in food, transportation, and industrial materials, and it wasn’t a positive one. With inflation already threatening the economy and the Fed getting ready to tighten monetary policy to fight it, the war in Ukraine made a challenging environment for the economy, yet more challenging. For the first half of the year inflation was marred by high fuel costs and rising food costs. By mid-year fuel costs settled down a bit but food prices continued to rise. Consumers began to travel once again, and those costs skyrocketed with increased demand.
Inflation
When I wrote last year’s yearend note, you may not be surprised that I dedicated an entire section on inflation. I tore out the section and pasted it below in case you missed it.

I took the liberty of circling the important points. The first is that at the close of 2021, the Consumer Price Index / CPI was at its highest level since the 1980’s. You will also note that the words “supply chain” are double underlined. That’s it, now you remember, supply chain issues were prevalent throughout 2021, caused largely from rapidly shutting down the global economy and then rapidly switching it back on. The reason I went through the pain of literally tearing out a piece from last year’s review is to highlight the fact that it was inflation that was the root cause of most of 2021’s turmoil… and it would get worse! I have recreated the chart below to illustrate.
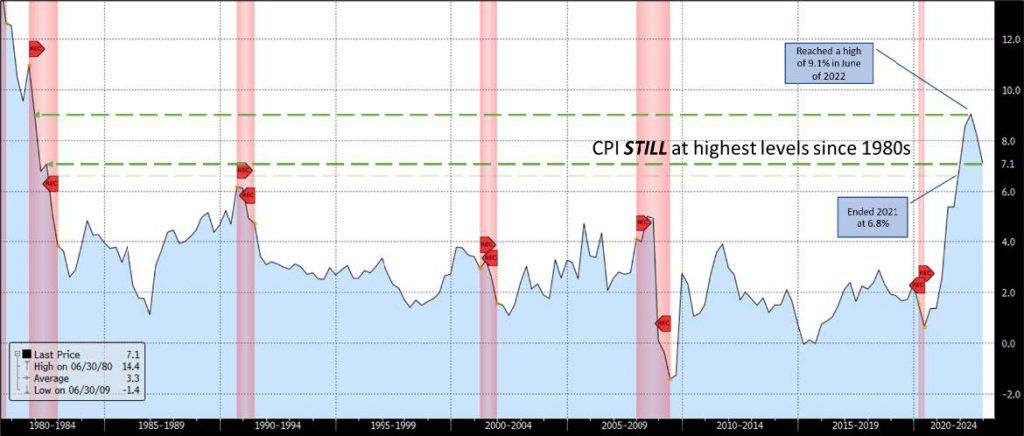
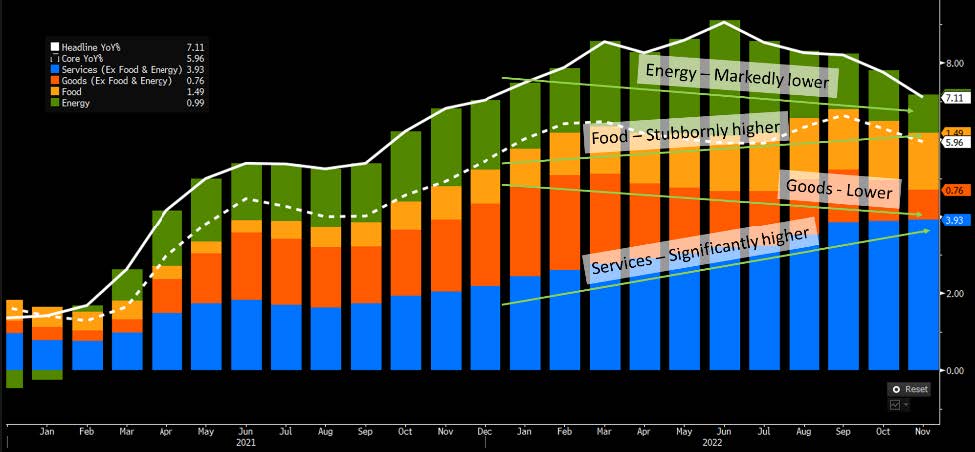
On this chart you will note that inflation continued to grow throughout the first half of the year, peaking at 9.1%, ultimately receding to 7.1% by year end, still higher than at the close of 2021, and still higher than at any other time since the 1980s. This year, however, things were a bit different for inflation. While last year’s inflation was largely attributed to supply chain costs skyrocketing and producers passing costs along to consumers, this year was market by continued supply hang-ups and accentuated by strong demand. This past year was the year in which consumers flexed their wallets. The next chart is the tell-all chart. On it you can see the breakdown of inflation, month by month. You will note that the green bars, energy, rose for the first half of the year, but pulled back in the second half. Goods (which is a technical term for stuff, like clothes, cars, dishwashers, table lamps, and soccer balls), along with energy drove the beginning of inflation starting in 2021. Once those pulled back in the second half of the year, it was food and services that grew at a rapid pace.
Late in 2021, the Fed began to talk about the necessity to fight inflation with tighter monetary policy. Talking about it alone was a policy move and that began to have an impact on the markets. When the Fed began to pivot in late 2021, CPI was at 6.8%. By February of last year, CPI had reached 7.9% and the Fed was ready to make its move. In its March FOMC meeting the Fed, expectedly raised the Fed Funds rate by +25 basis points, its first rate-hike since December 2018. That move along with the hikes that would follow it would drive capital markets throughout the year.
The Federal Reserve and Interest Rates
The Fed has a dual mandate 1) Keep inflation low, and 2) Keep employment healthy. Though that seems simple, it is, in fact, quite difficult. High inflation can be caused by low unemployment (more money to spend and high consumer confidence). It is usually difficult to get consumers to stop driving prices higher unless they are threatened by a) yet higher prices, or b) economic calamity like unemployment or recession… or both. The Fed has many methods to control those factors using Monetary Policy, principal amongst them is through interest rate policy. Simply put, the Fed lowers interest rates to stimulate growth, and it raises them to stifle consumption, demand, growth, and inflation. Higher interest rates mean that consumers financing purchases using auto loans, mortgages, personal loans, credit cards, etc. will have to make larger payments on already higher priced products, which will cause consumers to purchase less and ultimately allow prices to recede. Higher interest rates also have a large impact on companies who utilize borrowing for everything from, liquidity, capital improvements, general financing, real estates financing, equipment financing, leasing, etc. Higher interest rates mean higher increased expenses and lower margins. In order to maintain margins companies either raise prices charged to consumers or cut other expenses. In many cases those expense cuts lead to layoffs, and those layoffs… well, they mean less money to spend and lower consumer confidence. All that leads to lower demand and ultimately, the Fed hopes, lower inflation. Overly simplified, but a good representation of how raising interest rates can cause inflation to slow. There is just a bit more to it and then I will get back to the picture. One of the biggest cost contributors to most businesses is labor cost. When wages rise, margins get squeezed, and companies are forced to raise prices, similar to the case with higher borrowing costs. Companies don’t want to lose sales, so they are always reticent to raise consumer prices. Before companies raise prices, they will typically cut unnecessary expenses, and when those cost-cutting measure opportunities run out, they attempt to cut their labor force. However, if a company cannot afford to lose laborers, the company must resort to raising prices to consumers… inflation. When companies are struggling to fill open positions to attain critical labor mass, they are forced to pay higher wages to lure critical employees, therefore even if positions are able to be filled, labor costs go up, putting additional pressure on companies to raise prices.
The pandemic caused mass layoffs in a short period of time. Once the economy reopened, companies had a hard time filling positions to get their business back on track. The result was a tight labor market and increased costs, which contributed to initially, poor performance, but ultimately to price hikes and inflation. Coming into 2022, that perfect storm existed. The unemployment rate in 2022 went from low to… lower bottoming out at multi-decade lows. Meanwhile vacant job openings, according to the latest JOLTS report showed vacancies right below all-time highs since the numbers were tracked. Those are hallmarks of a tight labor market, and according to the Fed, a recipe for continued inflation. In 2023, in addition to headline inflation, the Fed will be watching the labor market very closely to see signs of its slackening. For now, 2022 ended with, and 2023 begins with a tight labor market.
The Fed Funds Rate
Now that we know what is driving the Fed’s policy, we need to examine what the policy makers have done to fulfill its dual mandate. As aforementioned, the Fed began its tightening cycle with a +25 basis-point Fed Funds hike in March of 2022. That first hike would be followed by 6 more hikes in 2022. The second hike would be an unprecedented +50 basis-point bump, followed by 4…even more unprecedented +75 basis-point increases, and finally topping off the year with another +50 basis-point increase.
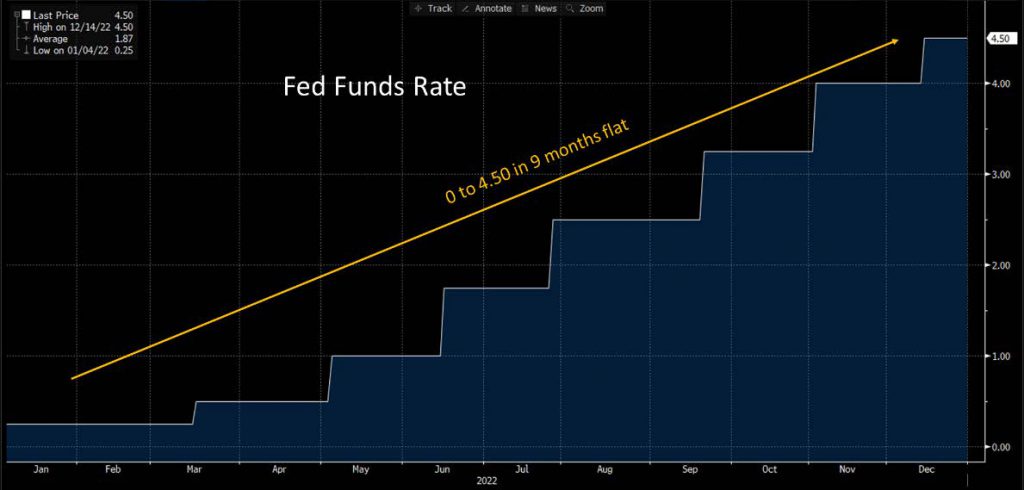
So, the Fed went from 0% to 4.5% in 9 months. The hikes caused havoc in the equity markets as well as the fixed income markets. The reverberation for that havoc led to chaos in other asset classes as well.
Bond Yields
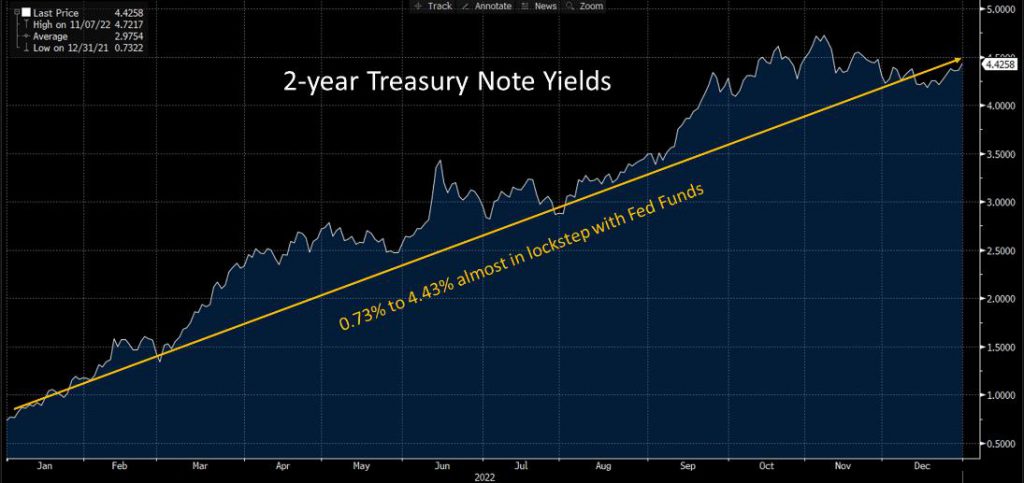
As you would expect, rate hiking has a direct impact on bond yields. The most direct impact is on shorter maturities such as the 2-year Treasury Notes, which started the year at around 3/4%, or 75 basis points. Yields on 2-year Treasuries attempt to forecast overnight rates 2 years in the future, so as the Fed turned up its rhetoric along with turning up its key lending rate, shorter term yields followed almost in lockstep.
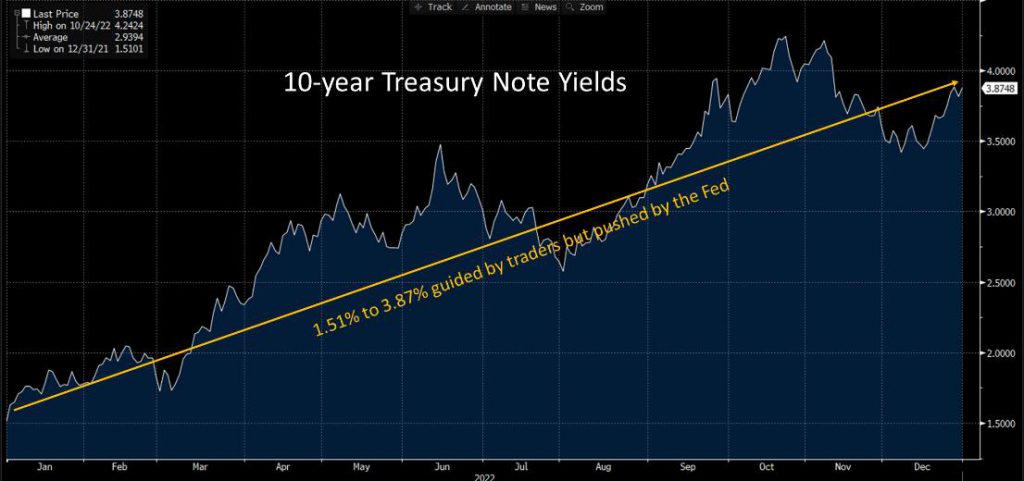
Longer maturities bonds like the 10-year Treasury Note also follow along with policy but are more subject to traders’ expectation about long-term economic health, long run prevailing interest rates, and longer-term inflation. Yield on 10-year Treasuries rose in 2022 as well, climbing from around 1½ % to 3.9%.
Beyond bonds
Rising bond yields have many implications. Foremost, bond prices move in the opposite direction of yield to maturity, therefore if yields are going up, prices are going down. That is not good news for investors who are invested in bonds, who lost value in 2022. Beyond the bond market, virtually all credit instruments are priced based on Treasury bond yields. That means auto loans, mortgage loans, credit card rates, etc. all went up along with yields… which were driven by Fed rate hikes. Finally, corporate bonds and municipal bonds are also priced based on Treasury yields. That means that a municipality or company wishing to borrow money by selling bonds to the public, they are all paying higher interest rates which rose along with Treasury yields… which were driven by Fed rate hikes.
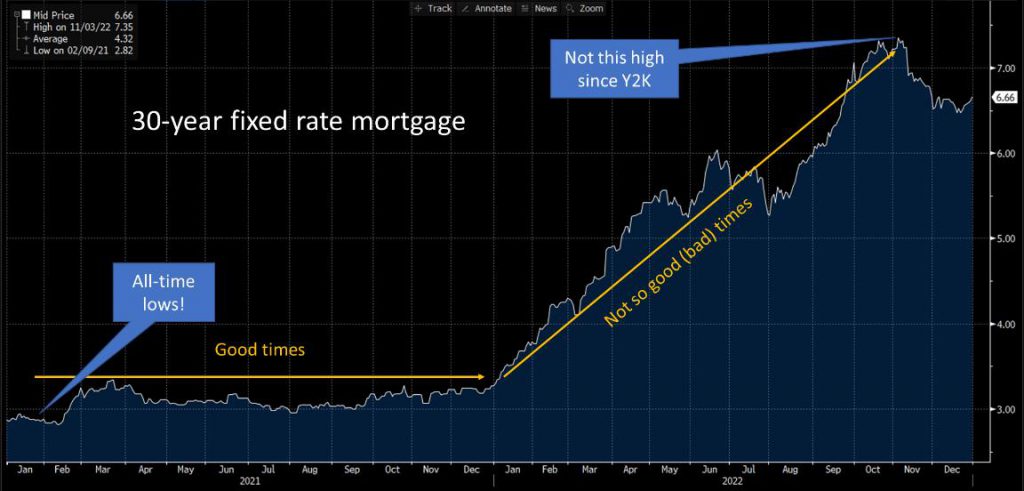
Housing market boomed, now busting
The housing market was limping along but doing just fine running up to the pandemic. The pandemic spurred breakneck growth as homebuyers clamored for a thinly supplied market. Mortgage rates were at all-time lows and families working and learning from home rushed to grab whatever they could to ride the storm out and lock in generational low rates. The following chart shows just how quickly existing home sales rose in 2020 and remained elevated in 2021. That strong demand pushed prices higher, adding to the inflationary environment.
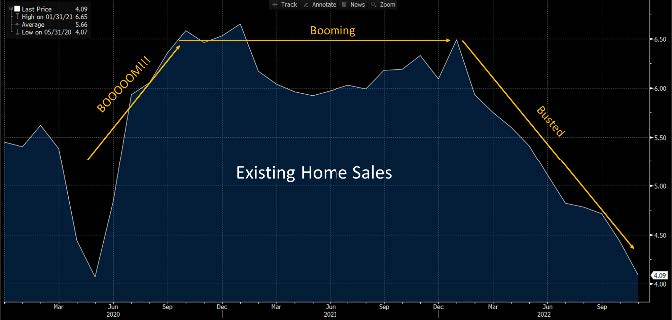
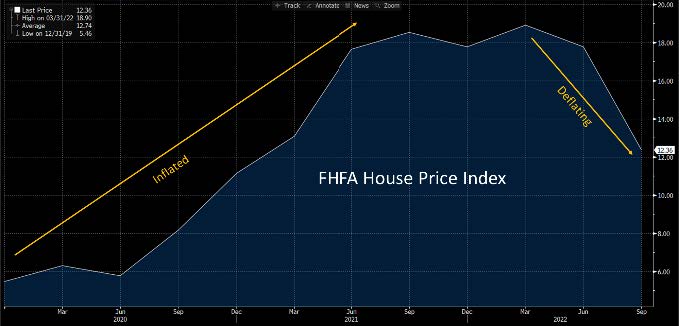
As you can see by the two charts above, home sales rose rapidly, stayed elevated, then quickly fell starting in March of 2022. Similarly, home prices rose through summer 2021, stayed high, then quickly began to decline starting in March. The next slide holds the answer for why this occurred (though you probably already know).
You may recall that the housing market was a big driver of general inflation, both directly and indirectly, but if you didn’t the FHFA House Price Index chart above should help you recall. There are numerous other examples, but in the housing market, it is clear that tighter Fed monetary policy has had a direct impact on at least one of inflation’s biggest catalysts.
The equity markets and bond yields
Stocks are stocks and bonds are bonds. They are supposed to be independent of each other. In fact, common wisdom was that investors needed to hold at least some allocation in bonds for the sake of asset class diversification. For a long, long time, when stocks fell, bonds would rise, therefore holding bonds would minimize portfolio losses in an equity downturn. To be fair, the relationship still holds on a long-term basis, but the relationship gets a bit out of whack during certain periods of time… like the ones we are in today.
We don’t have to get into the “whys” of the long-standing inverse relationship, but there are a few things we need to know in order to understand how bonds can affect stocks.
Stocks have yields, just like bonds
Many stocks pay dividends, which are highly coveted by not only income-target investors, but also many general investors view a company’s ability to pay a dividend as a sign of health. Some sectors and industries are known for their steady and attractive dividend yields. The two sectors which are most associated with dividend yields are the utilities sector and the real estate sector. The former being considered by many as an equity proxy for bonds. Because utility stocks are government regulated monopolies, their revenue streams are considered to be relatively stable which will enable the companies to maintain and possibly grow dividends over time. It is important to recognize that all utility companies are managed differently, and some are much riskier than others, so do your homework. If we look at the S&P500 Utility Sector, it currently has a dividend yield of around 2.93%. While that doesn’t seem like much, it is important to remember that 30-year Treasury bonds yielded 3% or less for most of the period that followed The Great Recession. Active investors will always seek the greatest return, so if utility stocks offer similar or better dividend yields with the opportunity for capital appreciation, bond holders will sell bonds and buy utility stocks. The same works in reverse! With all the rate hiking in 2022, 10-year Treasury Note yields rose to nearly 4%, making them more attractive to certain investors who would have sold their riskier utility stocks in favor of treasury bonds. Now, there are plenty of other factors, so the relationship is not always cut and dried… and it hasn’t been. More on that in the conclusion section. Let’s take that same analysis and use it to look at everyone’s favorite index, The S&P500. If you owned every stock in the S&P500 you would get a dividend yield of around 1.75% (or you can buy the SPY ETF, which has an actual dividend yield of 1.86%). Treasury Notes with a guaranteed yield of 3.87% if you hold on for 10 years or the S&P500 with the potential, but no guarantees (as we learned in 2022) of some upside? Better yet, let’s say you only want to lock your money up for 2 years? In that case, yields are even more attractive at 4.42%! Yet even better, a 12-month Treasury Bill closed out 2022 yielding around 4.65%… guaranteed by the US Government. So, you can see that stocks and bonds are in competition for at least some investors favor and higher yields therefore put pressure on equity markets, especially in times where yields, being driven by the Fed, are rapidly rising. But not all investors are seeking yield. Many are seeking principal growth; something which you are guaranteed not to get if you hold a bond to maturity.
Everyone loves… loved growth stocks
Growth stocks have been the engine wealth creation in a big way in wake of The Global Financial crisis. Those are companies that are typically found in the information technology, consumer discretionary, and more recently, the communications services sectors. Those stocks also exist in the healthcare sector, more specifically in the upstart biotech sub-industry. Growth stocks, as you may know, are companies that have the ability to achieve great earnings growth, usually through innovation or the discovery of new markets or new methods for addressing old markets. They all have one thing in common, at least the successful ones: they are able to continuously grow revenues, earnings, cash flows… market share or subscribers. Size does not make a growth company formidable, no, they are driven by growth alone. There are mega-cap growth stocks as well as small cap growth stocks, though the latter are riskier, as they are typically recent upstarts. If these upstarts are successful, they typically don’t remain small cap for long. More on that in a moment. Let’s first look back over the past 25 years and try to discern why investors love growth stocks so much.
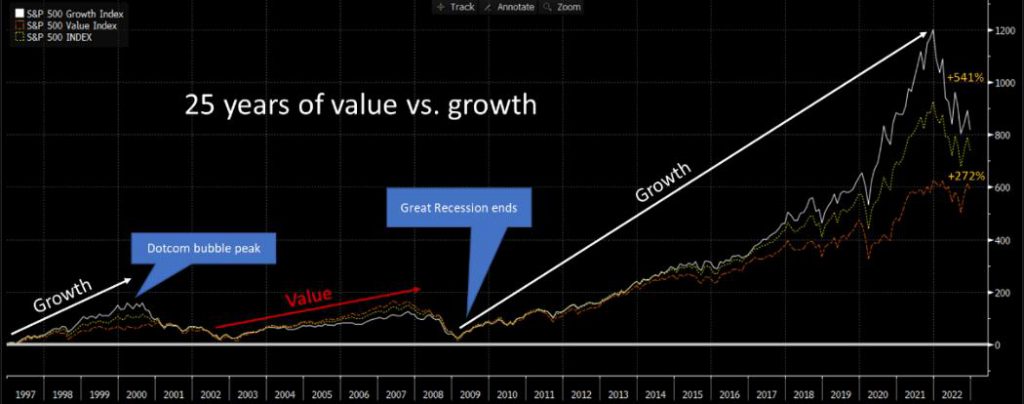
As you can see growth stocks outpaced value shares in 2 out of the three market regimes. Most notably, value outpaced growth in the wake of the Dotcom Bubble Burst all the way through The Great Recession, and from 2013 on through early 2022, at which point the two converged as value outperformed. In the end, if you held growth for the entire quarter century, you would have come out on top. In fact, if we narrow our scope from the end of The Great Recession through the end of 2022, growth won out over value +392% over +231%, including the pandemic… and yes, even including this past year. So, it should be clear why so many investors favor growth stocks.
What happened to growth stocks in 2022?
Based on the chart above, one can easily see that growth style investing offered a strong draw for investors. So, what did happen in 2022? In this case I will begin once again with a picture, though I am sure you don’t need it to jar your memory.
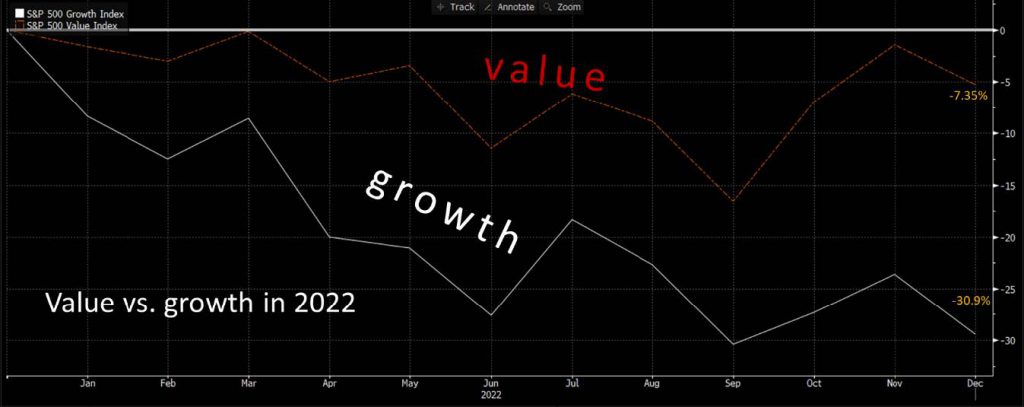
Now you remember, value did badly but, everyone’s favorite, growth really, really performed poorly. This combined with the popularity of growth investing left a lot of investors feeling rather under the weather for 2022.
Why did this happen?
There are two principal reasons for growth’s underperforming value.
1. It’s just plain math! The theoretical value of a stock encapsulates all future returns in today’s dollars. The complicated math to come up with that value has interest rates or bond yields in its denominator, so when it gets larger, the value solved, gets smaller. In growth stocks, much of their future cash flows are derived through, well… growth in the long run. If those are suddenly worth less in today’s dollars based on the equation and higher yields, the overall intrinsic value of a stock is lower. Trust me on the math, but if you want to learn more, just read my monthly newsletter from September of this past year entitled “Why are my growth stocks falling?” You can find that here.
2. All that great growth we are expecting in the future may not be as great as it might have been before the Fed slammed on the brakes. With tighter monetary policy companies will struggle to grow as quickly as they have in recent years. Growth companies are more susceptible to these changes as their earnings tend to be more volatile than those of value companies, which are typically more mature with more stable, but far slower if any, growth.
The US Economy
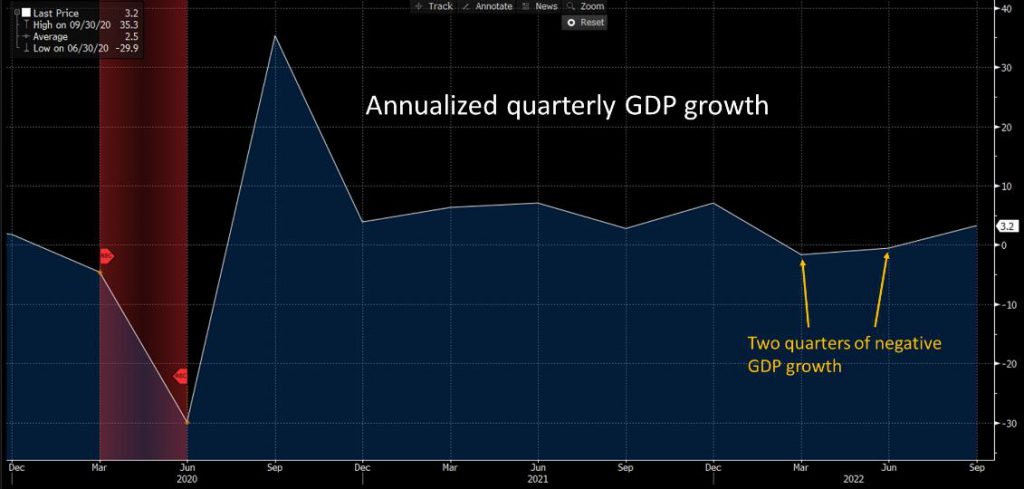
In the first 2 quarters of 2022, the US economy contracted. A recession is classically defined as two consecutive quarters of negative GDP growth. However, the official label of recession can only be bestowed by the National Bureau of Economic Research (NBER), which expands greatly on the requirements. Despite the negative GDP, NBER has yet to call the decline in growth an official recession. As you can see in the following chart of quarterly GDP growth quarters 1 and 2 of 2022 were slightly negative and appear minimal next to the pullback in 2020 resulting from the pandemic lockdowns. You will also note that in Q3 of this past year, positive growth returned. The first estimate of 4th quarter GDP will be released in late January of 2023. Analysts are forecasting a slower, but still positive, +0.4% growth.
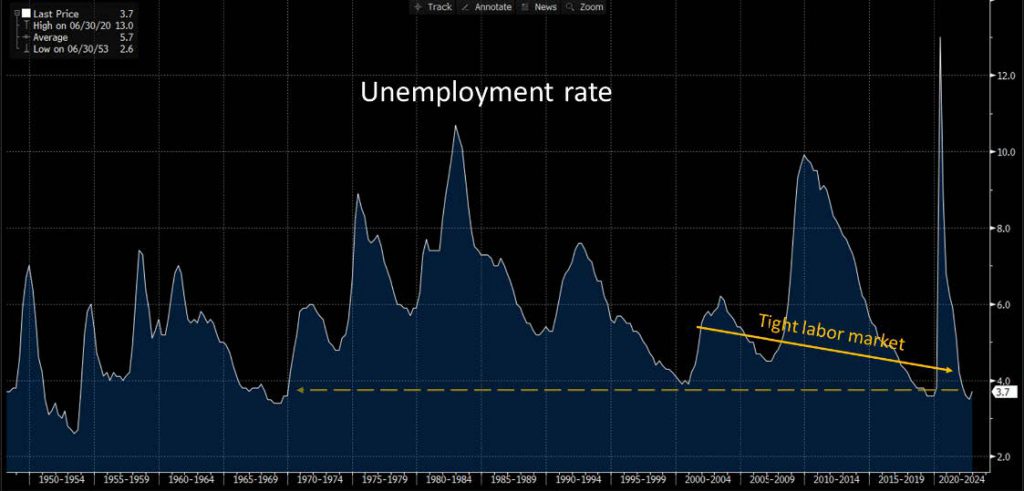
Unemployment, as mentioned above, is just above a multi-decade low! The unemployment rate is just around where it was prior to the pandemic, and it hasn’t been at these levels since 1969. While unemployment is considered a positive factor for the economy, it can also be a negative, spurring inflation, especially in an inflationary environment like the current one. As you will note from the following chart, the labor market is indeed tight.
Conclusion
2022 was a tough year for nearly every asset class. Equity indexes fell across the board as did bond indexes. The emergent cryptos market suffered heavy losses in 2022 as well. Crypto assets fell in sympathy with growth stocks and suffered heavy losses in the second and fourth quarters. A principal driver for the losses was the Fed’s aggressive interest hiking activities which were driven by high inflation that peaked mid-year and pulled back in the latter half of the year. Investors shifted assets from much-loved growth sectors into more defensive sectors such as utilities, consumer staples, and healthcare. Investors seeking shelter increased cash holdings and shifted to fixed income which offered the highest yields in many decades.
While the economy managed to recover from early GDP contractions, consumer confidence waned throughout the year causing many economists to predict a recession some time in 2023. Unemployment remained extremely low, which the Fed believes will further contribute to inflation. To fight inflation, the Fed aggressively raised interest rates to relieve inflationary pressure. Aggressively tight monetary policy, while effective, is a blunt tool and can wreak havoc on corporate earnings. Despite the challenging environment, corporate earnings have managed to stay healthy throughout 2022. Cracks began to emerge in earnings in the 2nd half of the year as many companies lowered forward guidance in anticipation of a tougher economic environment as well as increased costs brought on by a tight labor market and higher borrowing costs associated with tight monetary policy.
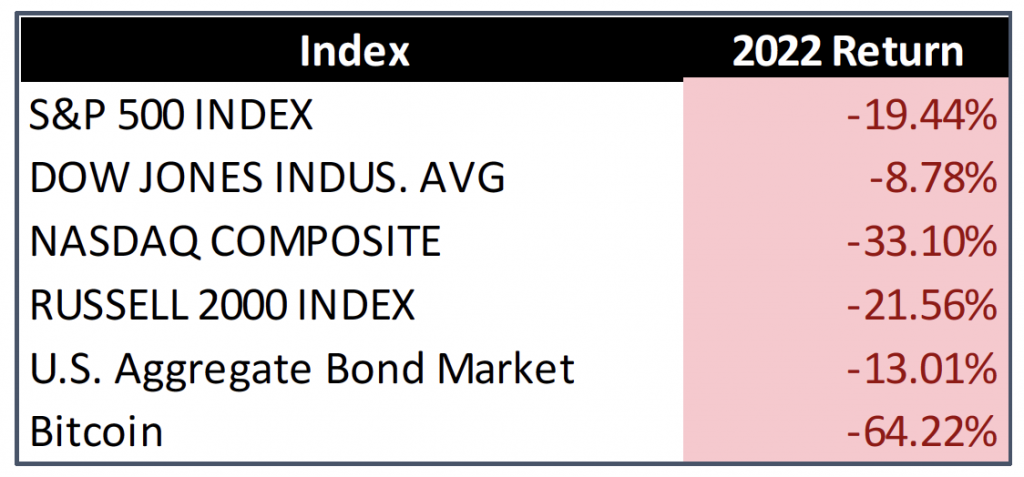
Finally, this next chart was your 2022 in one picture. It was a tough one.
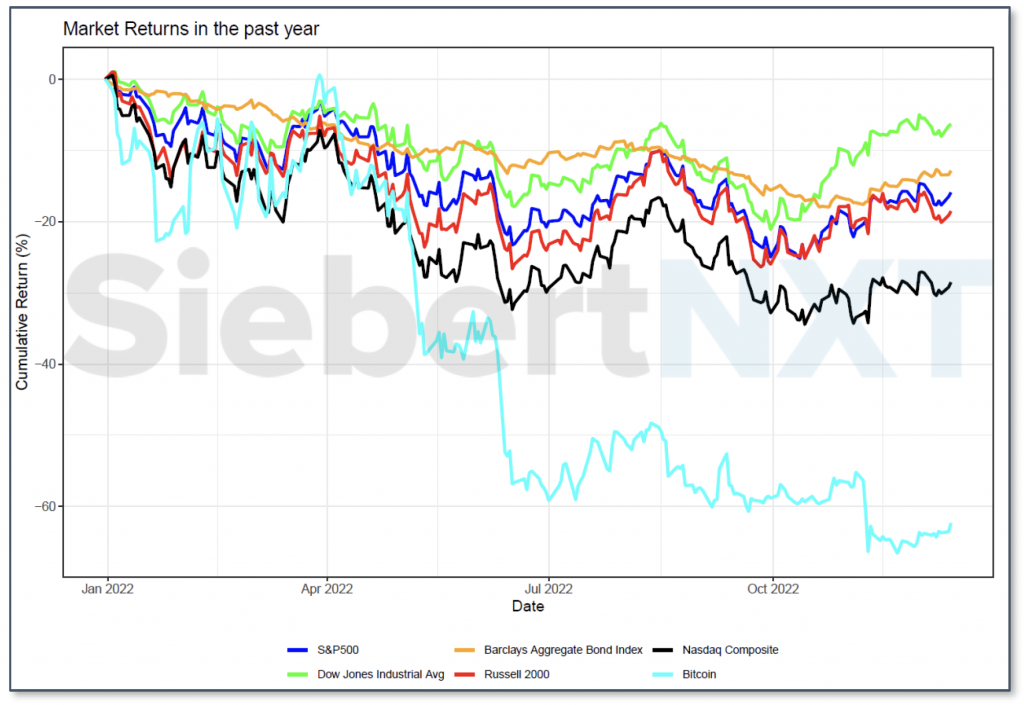
The following are the annual returns that correspond to the painful looking lines in the chart above.
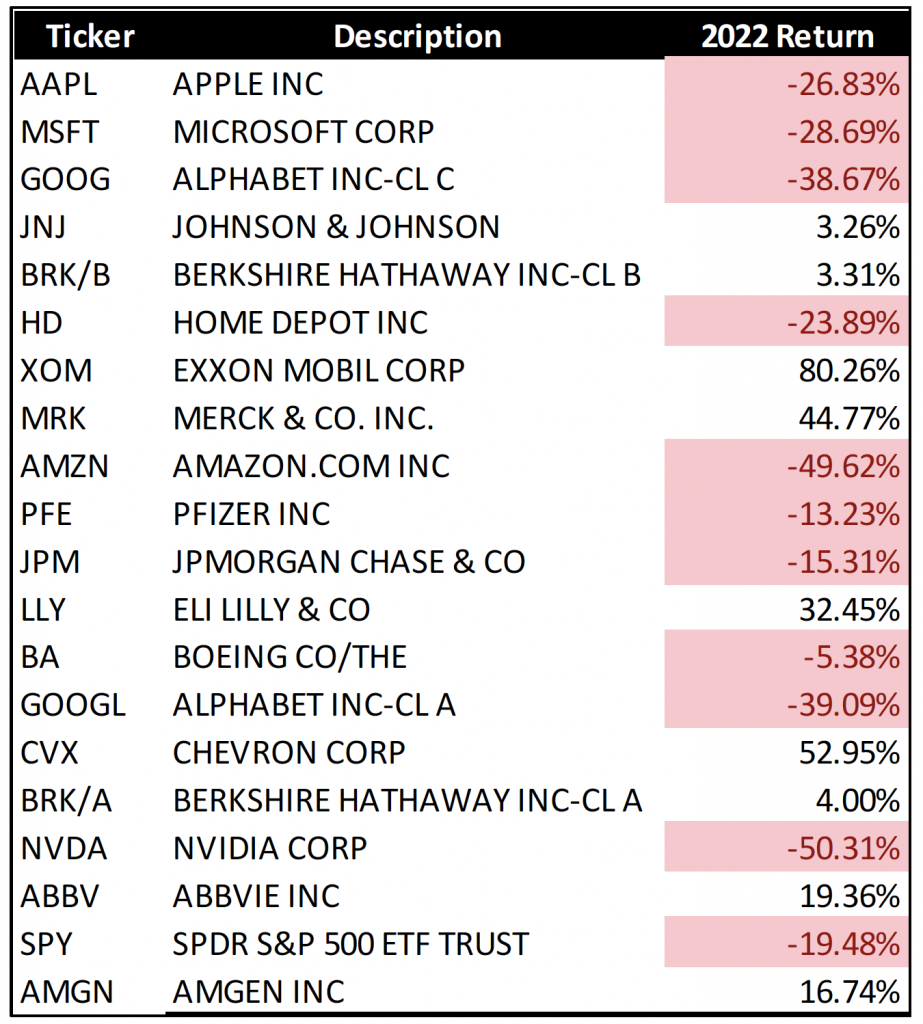
Siebert Superlative Portfolio
The following portfolio is a representative portfolio of a typical self-directed client. Though your portfolio may look somewhat different, you are likely to own or have owned some or all the following equities. The following table contains 2022 returns for each of the superlative members.
What is in store for 2023
The principal drivers for the markets in the year ahead have been carried forward from 2022, namely: inflation, Fed rate hikes, potential for recession, and corporate earnings.
Inflation
Inflation has been receding, but it is still too high, and it will continue to impact consumers’ purchasing power which will likely have an impact on corporate revenues. Many of inflation’s initial instigators came from tight supply. You may notice in all the inflation charts above that fuel, raw materials, and even food commodities (such as grains) inflation appears to have peaked in June of this past year and they are trending lower. This should continue to impact general inflation in a positive way, pushing it toward tolerable levels. Services prices continue to prop up inflation and are likely to continue doing so as a significant portion of discretionary income was shifted away from goods and into services like travel and leisure. Throughout 2022, personal savings as percent of disposable income fell indicating that consumers were tapping into savings in order to deal with higher prices and an increased appetite for consumption. Diminishing savings will ultimately have an impact on consumption and ultimately pressure inflation downward as well. While some of the pullback in inflation was instigated by the Fed rate hikes, clearing up of supply chain snags had an impact as well. All this will continue to press on inflation in 2023.
Fed rate hikes
The big question remains “when will the Fed end its rate hiking cycle?” According to the Fed, not any time soon, as long as things don’t fall apart with the economy. The Fed has essentially signaled that it expects to keep rates higher for longer, though the magnitude of future hikes may be smaller, following the trend of its final +50 basis-point hike for 2022. According to Fed’s projections, policy makers expect Fed Funds to end 2023 just above 5%, which is around +50 to +75 basis points higher than current. The Fed also does not expect the US to fall into a recession, according to its forecast. Based on Fed Funds futures, the markets are anticipating another +50 basis points or hikes by mid-year followed by -50 basis points in rate cuts by the end of 2023 bringing Fed Funds back to where they were at the end of 2022. This discrepancy in what the market expects and what the Fed wishes to do will surely work itself out over the upcoming year, causing more volatility across all asset classes.
Recession
An increasing number of economists are predicting a recession sometime in the second half of 2023, resulting from the Fed’s restrictive monetary policy. To be more precise a group of top economists puts the probability of a 2023 recession at 65%, though they do not expect the recession to be a deep one. An inverted yield curve which describes a situation when shorter maturity yields are higher than longer maturity yields have occurred 6 months to a year prior to almost all recessions in recent years. This ominous sign occurs when the Fed keeps short term interest rates painfully high for a long period of time and bond traders expect economic turmoil in the future. The yield curve between 10-year Treasury Notes and 2-year Treasury Notes has been inverted since July of 2022 and ended the year with a spread of -55 basis points, more inverted than it had been since 1981.
Corporate earnings
Analysts are expecting earnings to grow in the first 2 quarters of 2023, though sales are expected to be flat or lower. Companies can only achieve earnings growth in this environment through cost-cutting measures which are likely to include layoffs. In fact, many layoffs have already been announced, specifically across the tech and financial sectors as companies shift in anticipation of economic headwinds. If in fact the US does enter a recession the magnitude of it will be dictated by the depth of the layoffs that lie ahead.
The final word
Markets are starting 2023 in shaky legs as the Fed is still in its hiking cycle. Inflation, while lower, is still too high. Consumers are losing confidence, which is not good for an economy which is also on shaky legs. COVID still has the potential to disrupt growth, specifically in China and the war in Ukraine continues to rage on. Though it may feel like we are past the worst of things, there is still much to contend with going forward. That means more volatility ahead… at least until some or all these continuing factors sort themselves out.
IMPORTANT DISCLOSURES.
Muriel Siebert & Co., LLC is an affiliated broker/dealer of the public holding company, Siebert Financial Corporation, which also owns Siebert AdvisorNXT, LLC. Siebert AdvisorNXT, LLC is a registered investments advisor (RIA) with the SEC and with state securities regulators. We may only transact business or render personal investment advice in states where we are registered, filed notice or otherwise excluded or exempted from registration requirements. Investment Advisor products are NOT insured by the FDIC, SIPC any federal government agency or Siebert’s parent company or affiliates.
You are being provided this Market Note for general informational purposes only. It is not intended to predict or guarantee the future performance of any security, market sector or the markets generally. This Market Note does not describe our investment services, recommendations or market timing nor does it constitute an offer to sell or any solicitation to buy. All investors are advised to conduct their own independent research before making a purchase decision. This Market Note is to provide general investment education and you are solely responsible for determining whether any investment, security or strategy, or any other product or service, is appropriate for you based on certain investment objectives and financial situation. Do not use the information contained in this email as a basis for investment decisions. You should always consult your investment advisor and tax professional regarding your investment situation before investing. The charts and graphs are obtained from sources believed to be reliable however Siebert AdvisorNXT does not warrant or guarantee the accuracy of the information. Any retransmission, dissemination or other use of this email is prohibited. If you are not the intended recipient, delete the email from your system and contact the sender. This is a market commentary, not research under FINRA Rule 2210 (b)(1)(D)(iii) and FINRA Rule 2210 (c)(7)(C).
© 2021 Siebert AdvisorNXT All rights reserved.
