
Stocks had a mixed closed in an up-down day as anxious traders awaited big tech earnings and an eco-release storm. Meta asks investors to have faith.
A difference in opinion. When I write things like “analyst expectations” or “are expected to come in at,” or “probably gained,” I am, of course, referring to a descriptive statistic about a gaggle of experts out there. Do you want to know what the potential upside of a stock is? Sure, you do, so how do you find that out without sifting through mounds of public disclosures, sitting through countless conference calls, and doing complicated and easy-to-foul-up math in spreadsheets that probably have circular references? Well, if your tennis partner’s daughter is an analyst at some Wall Street Investment bank, you can ask her, and she will be happy to tell you. But what if her estimate of expenses in February was off by $30 million? Maybe the company did layoffs and its CFO decided to take some sort of expense up front rather than pay it out or push it into the current quarter. What if her estimate on unit sales for the quarter was too bullish and she didn’t factor in (because she was unaware) inventory buildup at the company’s largest customer due to inclement weather? These are all minor things in the big picture, but when it comes to rolling it all up into one net income figure, dividing it by the number of shares outstanding, and pressing the enter key to get the final EPS figure, it can mean the difference between a beat and a miss.
Oh, I know, maybe don’t rely on your friend’s daughter alone. You can call ALL the analysts out there and get a consensus. Better yet, collect all of their projections and do some basic statistical math. YES! That would be your best bet to satisfy your desire to know what to expect from an earnings release or an economic release. If that just got you all stressed out, don’t worry, because I got you covered.
This morning, we are due to get the first, or “advance” estimate of Q1 GDP. It’s an important number, and its importance is elevated now that the Fed is sitting on the fence about when to cut interest rates. A strong economy is good, in fact, always good, but it can have inflationary side effects, which these days has the same ick-effect as seeing a mouse in a restaurant 🐭. So, you can say that traders will be watching the release closely. That said, what are analysts expecting? Check out this chart.
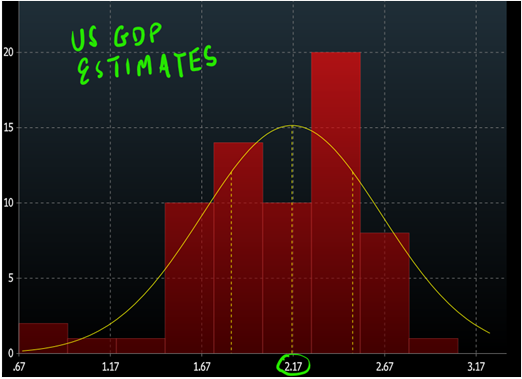
There you go, and if you look in my “NEXT UP” section below, you will see the GDP is expected to come in at +2.2%, which is just +2.17% rounded up. You can see by the chart that not all economists agree that +2.17 is THE number. No, not all. Indeed, the chart represents the estimates of 70 blue chip economists… 70! You can’t see it on the chart, but one economist at EconForecaster expects GDP to be +3.2%. What, you never heard of that company? Ok, The second highest estimate is from Goldman Sachs which expects GDP to come in at +3.1%. You can see by the chart that Goldman is in the minority over at the far right of distribution. Visually, you can see that the bulk of the estimates is between +1.76% and +2.67%. The middle of those two numbers just happens to be… em, +2.17%, which also happens to be the median. The mean, or average, of all 70 estimates just happens to also be +2.17%, in this case. That can be generally interpreted as not being skewed in one direction or another; the distribution is symmetric, which means that the data is evenly distributed around a central value (which you can kind of see by eyeballing the chart). You can also see just by visualizing the chart that the left tail appears more prominent than the right, which means that there is negative tail risk… assuming you trust that those economists did their arithmetic correctly.
Indeed, Virtuoso Economics is expecting GDP to come in at +0.8%. Delving into Virtuoso’s forecast, we can see that the economist there expects consumer spending (the largest component of GDP 😉) to have grown by only +0.3% compared to the prior quarter which actually grew by +3.3%. That is a BIG quarterly decline, and I am sure that the economists at Virtuoso have a good thesis for it, but it is nonetheless, not a popular view based on the 70-economist sample. What seems to be popular is the +2.3% to +2.5% group (or bin, which is the technical term) that has the backing of 20 economists.
That may be a popular table in the lunchroom, but it really doesn’t reflect the overall sentiment of the class. For that, we have to zoom back out and go to the mean, which in probabilities is the EXPECTED VALUE, which in this case is +2.17%. Where does your tennis partner’s daughter fit in this group? I don’t know, but there is no harm in asking her.
WHAT’S SKEWING THE MARKETS THIS MORNING
Align Technology Inc (ALGN) shares are higher by +5.17% in the premarket after it announced that it beat on EPS and Revenues. The maker of Invisalign teeth straighteners also bolstered its forward sales guidance to the high end of analysts’ estimates. In the past month 8 analysts have raised their price targets while none has lowered them. Potential average analyst target upside: +6.6%.
Meta Platforms Inc (META) shares are lower by -14.51% in the premarket after the company announced that it beat EPS and Revenue estimates by +3.43% and +0.91%. The company gave current quarter guidance which was in line with estimates and raised full-year EPS guidance. The company also announced greater capex figures which are related to its AI investments. The increase in spending was clearly not welcomed by traders this morning, however analysts are generally supportive of the move to bolster the companies AI efforts. Zuckerberg urged investors to be patient 🤔. Dividend yield: +0.40%. Potential average analyst target upside: +6.9%.
Also, this morning: Honeywell, Dow Inc, TransUnion, Valero Energy, Royal Caribbean, Merck, Lab Corp, Bristol-Myers Squibb, Comcast, Keurig Dr Pepper, Northrop Grumman, Union Pacific, and Hess Corp. all beat on EPS while Carrier Global, International Paper, Tractor Supply, PG&E, American Airlines, Caterpillar, Valley National Bancorp, and Newmont came up short.
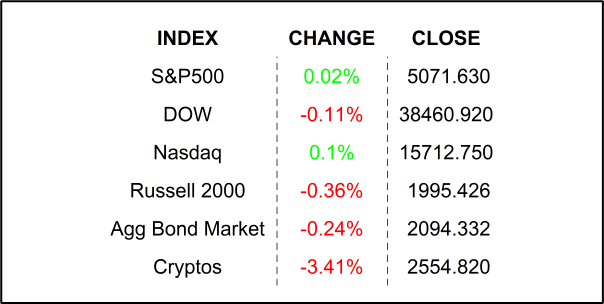
YESTERDAY’S MARKETS
NEXT UP
- Annualized Quarterly GDP (Q1) is expected to come in at +2.5%, down from Q4’s +3.4% growth.
- Initial Jobless Claims (April 20) is expected to come in at 215k, slightly higher than last week’s 212k claims.
- Pending Home Sales (March) may have risen by +0.4% after gaining +1.6% in February.
- The Treasury will auction off $44 billion 7-year notes.
- Earnings after the closing bell: Capital One, VeriSign, Juniper Networks, Alphabet, Gilead, Western Digital, Roku, Microsoft, Snap, L3Harris, Teladoc, Intel, Skechers, and T-Mobile.
IMPORTANT DISCLOSURES.
Muriel Siebert & Co., LLC is an affiliated broker/dealer of the public holding company, Siebert Financial Corporation, which also owns Siebert AdvisorNXT, LLC. Siebert AdvisorNXT, LLC is a registered investments advisor (RIA) with the SEC and with state securities regulators. We may only transact business or render personal investment advice in states where we are registered, filed notice or otherwise excluded or exempted from registration requirements. Investment Advisor products are NOT insured by the FDIC, SIPC any federal government agency or Siebert’s parent company or affiliates.
You are being provided this Market Note for general informational purposes only. It is not intended to predict or guarantee the future performance of any security, market sector or the markets generally. This Market Note does not describe our investment services, recommendations or market timing nor does it constitute an offer to sell or any solicitation to buy. All investors are advised to conduct their own independent research before making a purchase decision. This Market Note is to provide general investment education and you are solely responsible for determining whether any investment, security or strategy, or any other product or service, is appropriate for you based on certain investment objectives and financial situation. Do not use the information contained in this email as a basis for investment decisions. You should always consult your investment advisor and tax professional regarding your investment situation before investing. The charts and graphs are obtained from sources believed to be reliable however Siebert AdvisorNXT does not warrant or guarantee the accuracy of the information. Any retransmission, dissemination or other use of this email is prohibited. If you are not the intended recipient, delete the email from your system and contact the sender. This is a market commentary, not research under FINRA Rule 2210 (b)(1)(D)(iii) and FINRA Rule 2210 (c)(7)(C).
© 2021 Siebert AdvisorNXT All rights reserved.
