

Usually, when I write my year end reviews, I am able to jot down a few milestone events and fill in the details. As you might guess, 2020 and perhaps, even more so 2021 would prove to be a bit more, shall we say… complex. We started the year on the tails of a second COVID wave driven by late 2020 merry making, perhaps a celebration, premature, that vaccines were about to put an end to the pain. As the virus goes it seemed like smooth sailing. We had a new administration in the White House and Democrats had a slim majority in both chambers of Congress, which should have made passing massive, economy stimulating spending packages straight forward. At the head of the year, the Fed was focused on keeping economic growth on track, but more importantly getting Americans back on the job. They would accomplish those ambitious goals through ongoing monetary stimulus, namely bond buying and maintaining low interest rates. It was set to be a rebirth year for the economy.
COVID-19
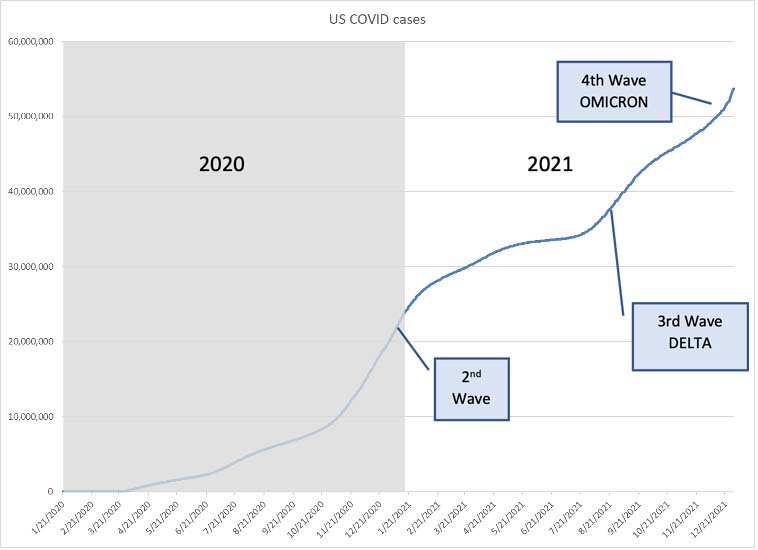
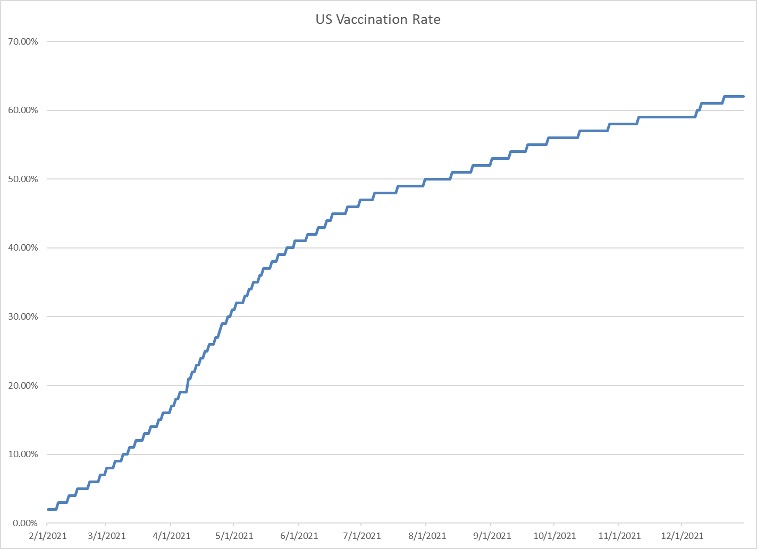
At this point, COVID is no longer just an elephant in the room as it is quickly becoming a way of life. We entered 2021 on the back end of a second wave which was quickly quashed with the rapid increase in vaccinations in the first quarter. First came the voluntary vaccines and that led to mandatory vaccines. Just as we prepared to embrace our first COVID-free summer, a new variant emerged: DELTA. The DELTA-variant was more transmissible but equally dangerous as previous strains. DELTA had a devastating effect on regions of the country with lower vaccination rates. This led to the 3rd wave which devastated the US starting in late summer. It was also at this point that we first learned of breakthrough cases in which vaccinated folks were susceptible to infection. A massive effort was spent to get more people vaccinated and mandates became more invasive. At first it was just rumored, but the experts began talking about a booster, a third shot for Pfizer and Moderna vaccine recipients. Studies began emerging which posited that a third dose would be effective at preventing the new DELTA-variant and breakthrough infections presented with weaker symptoms. By October vaccination rates were on the rise and the curve began to flatten once again. Then came the OMICRON-variant, estimated to be 10 times more transmissible than earlier strains. This came just as folks prepared to gather for the Thanksgiving Holiday. Large gatherings and increased travel proved to be the perfect storm needed to start the 4th wave with DELTA still on the loose but with OMICRON dominating the infections.
If there is any consolation, the now dominant OMICRON-variant has proven to be less lethal than past variants. Experts are beginning to believe that COVID is transitioning from a Pandemic to an Epidemic, which affects only certain groups. Further, some experts believe that the less deadly OMICRON-variant will bring it to an Endemic, which is ever present in select regions or classes of society, like the flu virus. Perhaps that is why the equity markets, once vexed with fears of a 2020-style lockdown, have managed to make new highs as lines for COVID tests and vaccines get longer and longer. We are learning to exist with the ever-present virus and so are the markets… for now.
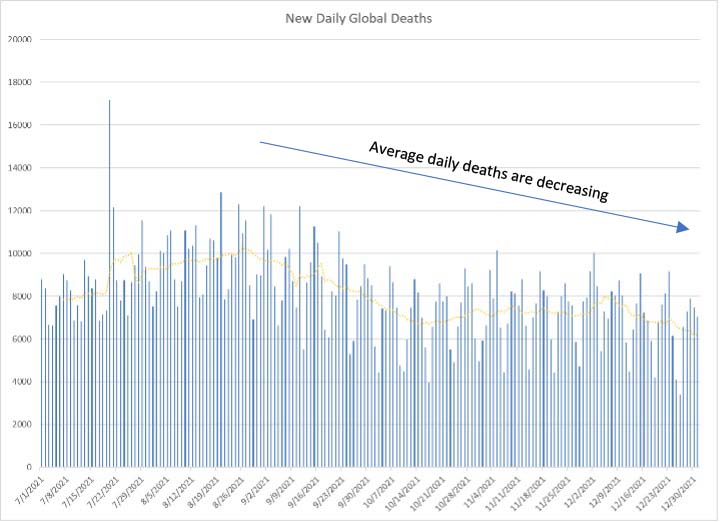
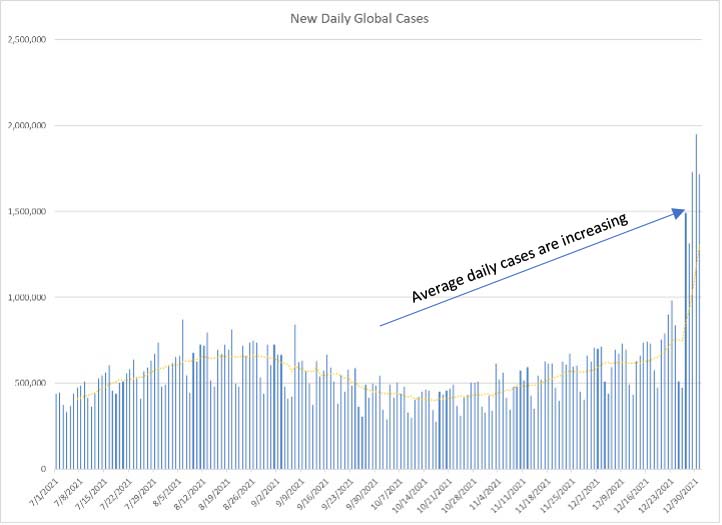
As can be seen by the charts above, average daily cases are increasing while average daily deaths are decreasing (gold dotted line is 7-day moving average). While increasing cases are not good, decreasing daily deaths are positive.
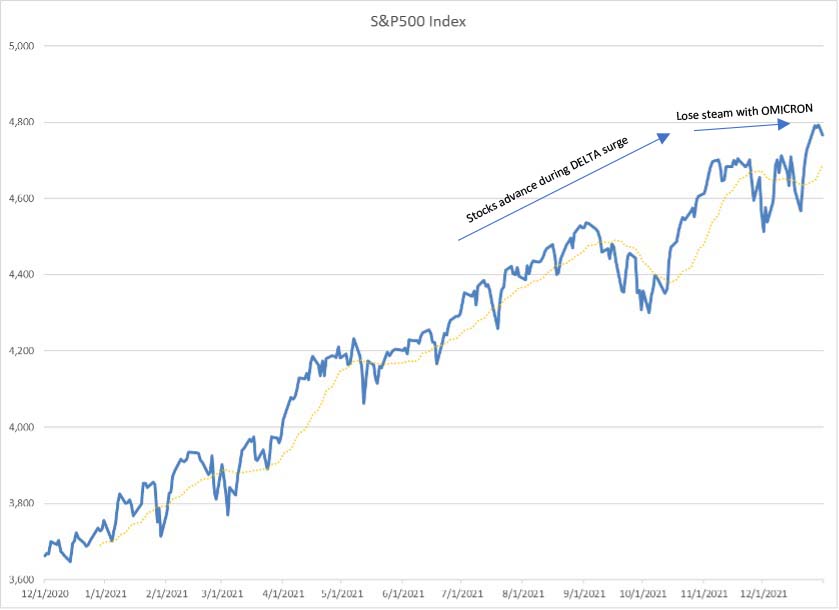
COVID as a Market Driver
While one would expect COVID cases, in general, to have a negative effect on equity markets, the correlation is unclear, as observed by the following chart. Stocks actually advanced with the more deadly DELTA-variant but fizzled out with the less deadly, more transmissible OMICRON-variant.
The Federal Reserve and Inflation
The Fed is responsible for keeping unemployment low while simultaneously ensuring that inflation remains tame. This is referred to as the Fed’s dual mandate. It accomplishes these goals through monetary policy. Historically, the Fed would lower key lending rates to stimulate economic growth / employment and raise those rates to slow demand, thereby tamping down inflation. Of course, it is more complicated than that, but for the most part the Fed advances and withdraws stimulus to accomplish its dual mandate. When the pandemic struck in 2020, the Fed advanced an unprecedented stimulus package which included, amongst many different loan facilities, a Fed Funds Rate cut and a Quantitative Easing package. Quantitative easing, or QE, in this case meant that the Fed would purchase up to $150 billion in Treasury and Mortgage-Backed securities every month. This would serve to keep rates lower (massive buying pushes prices higher and yields lower) and to add liquidity (literally cash) into the markets. The Fed actually began to lower its Fed Funds Rate in the summer of 2019 to stimulate a stagnating economy. The “mid-cycle adjustment”, as the Fed termed it, had a positive effect on the economy and the markets. In 2020 when the US and almost every developed country went into a lockdown, the Fed rapidly lowered the Fed Funds Rate to 0% which played a big role in reversing the stock market slide and ending the recession that ensued from the lockdowns.
Talking the talk
Another tool used by the Federal Reserve is Jawboning, or Moral Suasion. This involves the Fed attempting to influence consumers with words. Of course, the Fed does not use those particular terms, choosing to use the more politically correct term: guidance. The Fed has learned that if it promises to be accommodative with policy, consumers and markets respond positively, and vice versa when it gives restrictive guidance. This is also referred to as a dovish (accommodative) or a hawkish (restrictive) stance. After raising rates starting in late 2015, the Fed shifted to dovish guidance in late 2018 reversing a market selloff. The Fed is said to have maintained its dovish stance until earlier this year when Fed governors began to call for rate hikes to fight the emerging threat of inflation.
Despite these verbal individual threats of rate hikes, the Fed’s public policy statements and actions continued to be accommodative. The Fed’s policy statements promised continuous near-zero rates for the foreseeable future. It further promised not to launch any hikes until its QE program ended. That would all change later in 2021.
Inflation
Though this topic deserves a heading all on its own, its close relationship to Fed policy warrants its inclusion herein. Inflation is where the rubber meets the road in the economy, especially when it comes to consumers. Consumption makes up roughly 2/3 of US GDP making it vital to the success of the economy and the markets. A key factor in consumption is inflation. Inflation diminishes the purchasing power of your hard-earned dollars, especially if your income is not growing at a faster pace. The problem of price inflation is not a new problem and is historically responsible for countless deadly revolutions, beheadings, government overthrows… the works. So naturally, to keep GDP growing and… revolutions from occurring, we would like to see inflation kept under control, and it has been since the late 1970’s and 1980’s when it ran rampant. In the following chart of year over year change in the Consumer Price Index, inflation spiked several times in the past 40 years and was usually associated with a recession. In the first 3 recessions pictured in the chart, inflation was one of the principal causes of recession, while in the 2008 Great Recession, inflation was a symptom of the recession. Historically, out of control inflation caused the Fed to take aggressive action to slow consumption which led to recession in many cases. In the 2008/2009 recession prices rose as result of aggressive Fed stimulus which prompted consumption. In that case, inflation quickly receded and spent the following years right around +2%, which happens to be the Fed’s target rate, with little or no intervention.
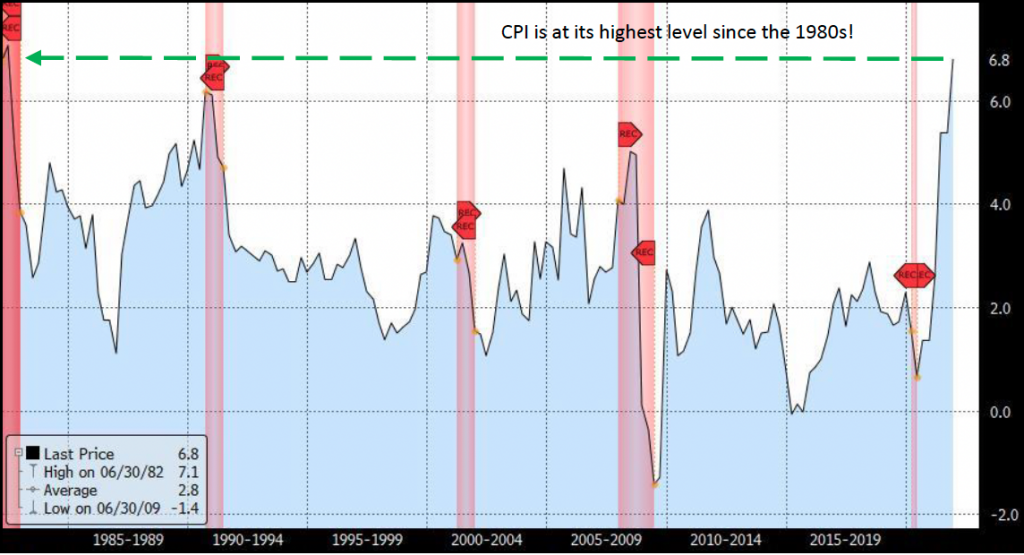
2021 would prove to be a challenge as the CPI rocketed higher resulting from supply chain constraints and increased demand. The rapid shutdown and reopening of the global economy exposed weaknesses in the global supply chain in just about everything from complex semiconductors and assemblies to raw materials such as lumber and glass bottles. Further the logistics of getting those items from shore to shore and to their final destinations would prove to be further challenging as empty shipping containers began to pile up in all the wrong places. Truck driver shortages meant that trucking companies either could not get goods delivered and had to pay higher wages to motivate drivers. As the economy reopened consumers, flush with cash and savings, were eager to spend money. That increased demand combined with diminished supply caused prices to rise. The latest read on CPI (year over year through November), has it at 6.8%, having risen from 1.4% in January, and well above the Fed’s 2.0% target.

When doves fly
The Fed has been quite busy getting the economy back on track, honoring part 1 of its 2-part mandate: low unemployment. While unemployment is not quite where it was prior to the pandemic, it is certainly improving (see unemployment rate chart). This improvement allows the Fed to now focus on part 2 of its mandate: low inflation.

The Dots have it
The Fed releases economic and rate projections made by each of the Federal Open Market Committee (FOMC) members 4 times a year. The release gives us some important insight into what the folks who make the policy decisions are expecting. If a member expects inflation to pick up over the next year and projects that the Fed Funds Rate will be higher by +25 basis points, there is good chance that the member will vote to raise rates at some point between now and next year. No guarantees, of course, but probabilities are in favor of those projections becoming reality… assuming the circumstances don’t change significantly. The most famous of the Fed’s projections is the dot plot, which plots each member’s Fed Funds projection over the next several years. In the Fed’s December meeting, one can observe from the dot plot below that, on average, that Fed members expect Fed Funds to close out 2022 around 0.875%, on average.

More importantly is how FOMC sentiment changed from its March meeting through its December meeting. Note from the following chart how September (red curve) revealed the first hawkish pivot, while December (green curve) shifted higher yet. All this despite March’s curve revealing Fed members’ expecting no change through 2023.

The market too, shifted its 2022 projection in line with the Fed after its September meeting. This can be seen in the daily time series chart of Fed Funds futures which expire in April 2022. Note a markable downward shift in September and a further shift in November after the Fed announced that it would begin to wind down (or taper) its stimulatory bond buying programs.

These moves by the Fed had a direct impact on stocks, as evidenced in the following S&P500 chart.

Bonded
One might expect that interest rate policy would have a direct impact on the bond market, and in fact, it did. The following chart of 2-year Treasury yields shows how the dot plot shift and ultimately the taper speed-up caused 2-year yields to increase materially.

Though 10-year yields closed the year out with gains as well, the driver for that market action was based less on Fed policy and more on market forces, which bet that economic challenges and lower inflation may be in the future.

In conclusion
There were 3 primary themes that drove markets in 2021: COVID, Fed Policy, and Inflation. The S&P500 rose by +26.89%, the Dow Jones Industrial Average advanced by +18.73%, the Nasdaq Composite climbed by +21.39%, and the Russell 2000 Index traded higher by +13.70%. For the S&P, 2021 capped off 3 years of above-average gains, with the last two overshadowed by a pandemic. 2021’s gains were achieved despite 3 COVID surges. We started the year with the backend of an ALPHA surge which eased, only to take us to the DELTA surge of midsummer, which ultimately crashed into the OMICRON surge… still surging.
Bond yields are higher, but perhaps not as high as many expected, with 10-year treasury yields adding just +60 basis points and 2-year Treasuries, more closely tied to Fed policy, gaining +61 basis points. Tight supply and increased demand helped crude oil prices jump by +58%, which is quite exceptional based on its recent trend leading up to the pandemic.
Corporate earnings were resilient despite the challenges of 2021 with the S&P500’s annual earnings per share expected to be +70.6% higher than 2021 and +37.1% higher than 2019. Bitcoin capped off the year with a gain of +59.8% (though not in a straightforward way) while the broader crypto market jumped by +153.29%, thanks to the many lesser-known cryptocurrencies that hit the scene in the past year.
Initial Public Offerings kept bankers busy this year, totaling 2,388, some +64% higher than the previous year, according to Ernst & Young. Meme stocks were a thing this past year. Remember GameStop, Blackberry, and AMC Entertainment? Those stocks were up by +687.63%, +41.03%, and +1,183.20% respectively. The company synonymous with those meme stocks, Robinhood went public last year, and it ended the year with a loss of -53.26% (from its IPO price). Regarding inflation, Consumer Price Index, CPI, grew by +6.8% from last November through November of this year (we will get the final read on CPI next week).

What will 2022 hold for us? At current, the odds favor 3 interest rate hikes by the Fed which should inject additional volatility into fixed income and equity markets. COVID remains a big wildcard for 2022 because, as we learned in 2021, you can’t underestimate its ability to reemerge with new and different twists. Just how much COVID will affect earnings will certainly be linked to how long the current and potential future surges last. Many economists have already lowered GDP expectations for the coming year in anticipation of the ongoing virus threat. Those same economists expect high inflation to ease a bit but remain uncomfortably high for 2022.
Opinions on the supply chain problems that are driving inflation vary wildly, but the general consensus seems to be pointing to persistent challenges for much of the upcoming year. Both equity and fixed income markets are factoring in further inflation, more COVID, and the Fed hiking rates at least three times. The Fed has clearly pivoted into the hawkish camp. With those tough hurdles ahead of us, many analysts believe that markets may be set up for positive surprises in 2022. We can certainly count on surprises; however, it is too early to tell whether they will be positive or otherwise. As we have learned from the past few years, an awful lot can happen in the 251 trading sessions that await us in 2022.
IMPORTANT DISCLOSURES.
Muriel Siebert & Co., LLC is an affiliated broker/dealer of the public holding company, Siebert Financial Corporation, which also owns Siebert AdvisorNXT, LLC. Siebert AdvisorNXT, LLC is a registered investments advisor (RIA) with the SEC and with state securities regulators. We may only transact business or render personal investment advice in states where we are registered, filed notice or otherwise excluded or exempted from registration requirements. Investment Advisor products are NOT insured by the FDIC, SIPC any federal government agency or Siebert’s parent company or affiliates.
You are being provided this Market Note for general informational purposes only. It is not intended to predict or guarantee the future performance of any security, market sector or the markets generally. This Market Note does not describe our investment services, recommendations or market timing nor does it constitute an offer to sell or any solicitation to buy. All investors are advised to conduct their own independent research before making a purchase decision. This Market Note is to provide general investment education and you are solely responsible for determining whether any investment, security or strategy, or any other product or service, is appropriate for you based on certain investment objectives and financial situation. Do not use the information contained in this email as a basis for investment decisions. You should always consult your investment advisor and tax professional regarding your investment situation before investing. The charts and graphs are obtained from sources believed to be reliable however Siebert AdvisorNXT does not warrant or guarantee the accuracy of the information. Any retransmission, dissemination or other use of this email is prohibited. If you are not the intended recipient, delete the email from your system and contact the sender. This is a market commentary, not research under FINRA Rule 2210 (b)(1)(D)(iii) and FINRA Rule 2210 (c)(7)(C).
© 2021 Siebert AdvisorNXT All rights reserved.
