

Stocks gained yesterday after traders reconsidered the risks of owning bank shares. A Government backstop changes the calculus… somewhat.
Let the good times roll. “What are you talking about Mark, I am literally on the edge of my seat after reading your note every morning,” you assert, “good times… bunk!” The Fed wants to stop us from spending money. All that high demand from consumers quite literally caused inflation to explode on the upside. That high demand combined with the already throttled supply chain just made things even worse. But just how effective have the Fed’s draconian rate hikes been?
If you are basing your answer on what you experience at the grocery store, your beauty salon, or your local apparel store, you might think that things are getting even worse. If you base your answer on the headline Consumer Price Index / CPI things appear to be slightly better than a few months ago, but still quite bad. Yesterday’s headline number came in right on expectations at +6.0%, which is exactly 3 times greater than the Fed’s target. So, what is it that is causing this number to remain so high? Well, that appears to be a moving target. Check out this chart of year-over-year CPI which breaks down the number, then read on.
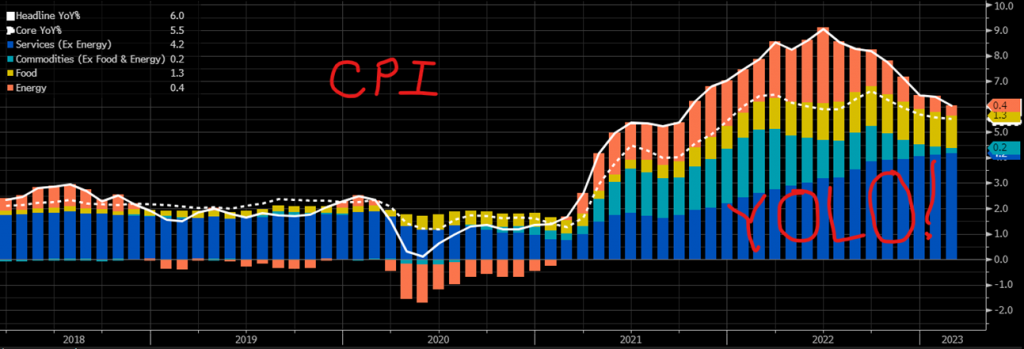
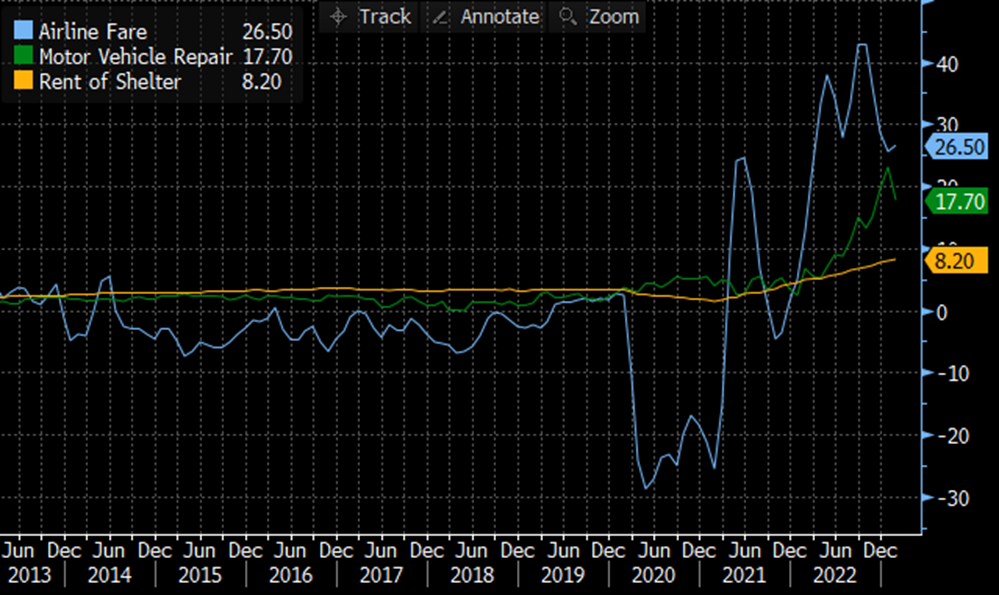
You can see on this chart how CPI as a whole burst to upside in early 2021. The initial gains were in Energy and “Commodities”, which contains mainly goods that don’t fit into other categories… you know, things, like dishwashers, furniture, clothing, cars, etc. By later 2021 when the Fed decided to share its monetary tightening ambitions, it was clear that inflation was being driven by rising fuel costs and consumers unending desire to purchase… er, stuff. Just compare the light blue bars in 2021 to the years prior to the pandemic. Similarly, you can see that energy costs were up and down in the years prior, but for the most part constrained. Now train your eyes on Services, the dark blue bars. Those were always a large part of annual inflation, but quite consistent around +1% to +1.5%. That would all change last year as one can witness its steady rise to around +4%… and rising. Food prices too were on the climb in 2022 and they have not yet receded, though they are still markedly higher than prior to the pandemic. Energy prices represented by the pink bars peaked in mid-2022 to create the perfect storm of peak inflation, driven by all categories. Goods inflation has since rapidly declined as has energy inflation. Food prices remain elevated, and services have shot through the roof and appear to be on a steady growth path. So, services appear to be the last remaining holdout. Within that category, Rent of Shelter is a standout, up +8.2% (which seems low… if you are from NYC), but extremely high compared to its historic average around +3%. Motor Vehicle Repair remains on the leader board with a gain of +17.7%, which is lower than its peak but still far higher than its historic average of sub +2% gains. Finally, that brings us to Airline Fare which is +26.5% higher than a year ago! Have freedom… and credit card, will travel, and the airlines know it. Air fare historically remained constant year over year. Check out this final chart to get an idea of just how stark these gains in services has been. The big question remains, can the Fed cause any of these consumption habits to change by continuing to raise interest rates? They haven’t yet.
WHAT’S SHAKIN’
Spillover from last week’s SVB debacle and some jitters from some overseas banks have reversed yesterday’s gains in banks. The premarket loser board is topped by names like Citigroup (C), Truist Financial (TFC), Capital One (COF), and Wells Fargo (WFC). There is significant premarket volatility, so things are likely to change by the opening bell.
Lennar Corp (LEN) is higher by +1.44% in the premarket after it announced that it beat ESP and Revenue estimates by +37.22% and +8.30% respectively. Purchase contracts exceeded analysts’ estimates and the company raised guidance for deliveries this fiscal year. Dividend yield: 1.48%. Potential average analyst target upside: +7.7%.
YESTERDAY’S MARKETS
Stocks staged a relief rally yesterday as investors bought the dip on banks beaten down a day earlier. The rally was helped by the CPI coming in more or less as expected. The S&P500 gained +1.65%, the Dow Jones Industrial Average climbed by +1.06%, the Nasdaq Composite Index jumped by +2.14%, and the Russell 2000 Index advanced by +1.87%. Bonds fell and 10-year Treasury Note yields gained +11 basis points to 3.68%. Cryptos gained +2.33% and Bitcoin climbed by +1.66%.
NEXT UP
- Producer Price Index / PPI (Feb) is expected to come in at +5.4% after a +6.0% print in January.
- Retail Sales (Feb) may have slipped by -0.4% after gaining +3.0% in January.
- NAHB Housing Market Index (March) is expected to have fallen to 40 from 42.
IMPORTANT DISCLOSURES.
Muriel Siebert & Co., LLC is an affiliated broker/dealer of the public holding company, Siebert Financial Corporation, which also owns Siebert AdvisorNXT, LLC. Siebert AdvisorNXT, LLC is a registered investments advisor (RIA) with the SEC and with state securities regulators. We may only transact business or render personal investment advice in states where we are registered, filed notice or otherwise excluded or exempted from registration requirements. Investment Advisor products are NOT insured by the FDIC, SIPC any federal government agency or Siebert’s parent company or affiliates.
You are being provided this Market Note for general informational purposes only. It is not intended to predict or guarantee the future performance of any security, market sector or the markets generally. This Market Note does not describe our investment services, recommendations or market timing nor does it constitute an offer to sell or any solicitation to buy. All investors are advised to conduct their own independent research before making a purchase decision. This Market Note is to provide general investment education and you are solely responsible for determining whether any investment, security or strategy, or any other product or service, is appropriate for you based on certain investment objectives and financial situation. Do not use the information contained in this email as a basis for investment decisions. You should always consult your investment advisor and tax professional regarding your investment situation before investing. The charts and graphs are obtained from sources believed to be reliable however Siebert AdvisorNXT does not warrant or guarantee the accuracy of the information. Any retransmission, dissemination or other use of this email is prohibited. If you are not the intended recipient, delete the email from your system and contact the sender. This is a market commentary, not research under FINRA Rule 2210 (b)(1)(D)(iii) and FINRA Rule 2210 (c)(7)(C).
© 2021 Siebert AdvisorNXT All rights reserved.
