

Have you noticed that the word “bubble” has become a common word in financial circles? There was the dotcom bubble, the housing bubble, the energy bubble… the list goes on. It has been added to the lingua franca and it is understood as something that ultimately heralds in pain, usually financial pain. And for good reason, because since it was first commonly used, it in fact, did predate pain. Now, it would be easy to look back at last year’s losses in growth stocks and attribute them to a burst bubble. It is true that growth stocks enjoyed a great run in the years prior to 2022. It is also true that many of those stocks were expensive. However frothy those valuations, last year’s drawdowns were not the result of some sort of second bursting of a tech bubble. The primary driver of last year’s market declines was… I think you know the answer by now, was rising interest rates. I covered the topic ad nauseum in my August 2022 newsletter entitled “Why are my growth stocks falling?” You can read that here: Why are my growth stocks falling? – Siebert. But this month I am referring to a different bubble. Namely a bond bubble. “What,” you exclaim? Bonds fell last year for the first time in, let’s say, a long time. You are thinking that, if there was a bond bubble, it surely burst last year.
Borrowing money
I want to start off by stating that there is nothing wrong with borrowing money. It is a very normal part of many consumers’ lives, and if used appropriately, can actually help one get ahead. From a corporate perspective, debt is a critical piece of cash management and allows companies to operate smoothly and invest in future growth. From a government perspective, it is also an important tool to enable countries to balance out their cash needs with their cash receipts (you know, taxes). Of course, I am oversimplifying all of this, but I am sure that you see my point. Debt is ok and it is normal… when used appropriately. Let us look more closely at corporate debt. Corporations borrow money in all sorts of ways and from different lenders. Today, I want to focus on bonds offered to the public… you and me. Before we get into it, just take a quick look at the following chart of outstanding corporate debt over the years.
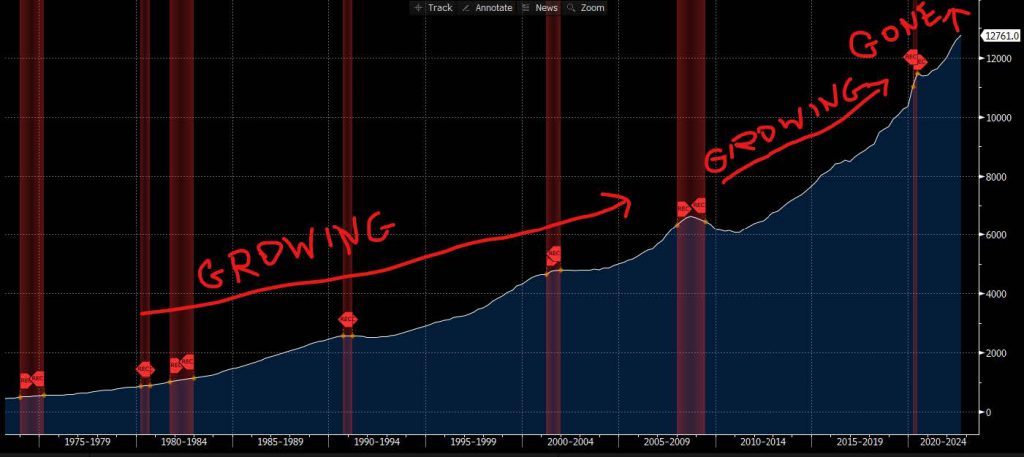
Don’t concern yourself with the actual amount of debt… it is a lot… but rather the path of the white line over the past 50 years. Yes, it grew quite a bit. Notice that I have marked off recessions during that period as well (shaded areas of red). You can see how borrowing peaked in 2007 just before the Global Financial Crisis and Great Recession and how it actually shrunk in the wake of the recession. However, starting in 2011, corporate indebtedness not only grew but it grew with a vengeance. That is one steep growth curve!
The cost of borrowing
What is the cost of borrowing? Just ask the Federal Reserve, it is in charge of borrowing costs. Most loans are indirectly related to Fed interest rate policy. When the Fed loosens, borrowing gets cheaper, and vice versa when it tightens. Let’s go back to The Great Recession. To tackle the recession, the Fed adopted a Zero Interest Rate Policy (ZIRP) which made corporate borrowing the cheapest it had been in… let’s call it… ever. Because borrowing had become so cheap, companies were able to support larger debt loads with the same or less cash flow. And companies DID take advantage of the cheap money. Most of it was put to good use, like investment and expansion. But some of it was also used for a more questionable activity. Many stock buybacks were financed through borrowing. Corporate treasurers would argue that equity was more expensive than debt, so they were simply shifting from one capital instrument to another. Of course, we also know that stock buybacks help stocks to climb. Less outstanding shares raises EPS (earnings per share) which effectively makes a stock more valuable. EPS doesn’t factor in debt load and while analysts and portfolio managers certainly look at that, most investors don’t. Regardless of what it was used for, you can see how a low interest rate environment can cause indebtedness to swell. Check out this chart of Fed Funds since 1955. Can you say “cheap money?”
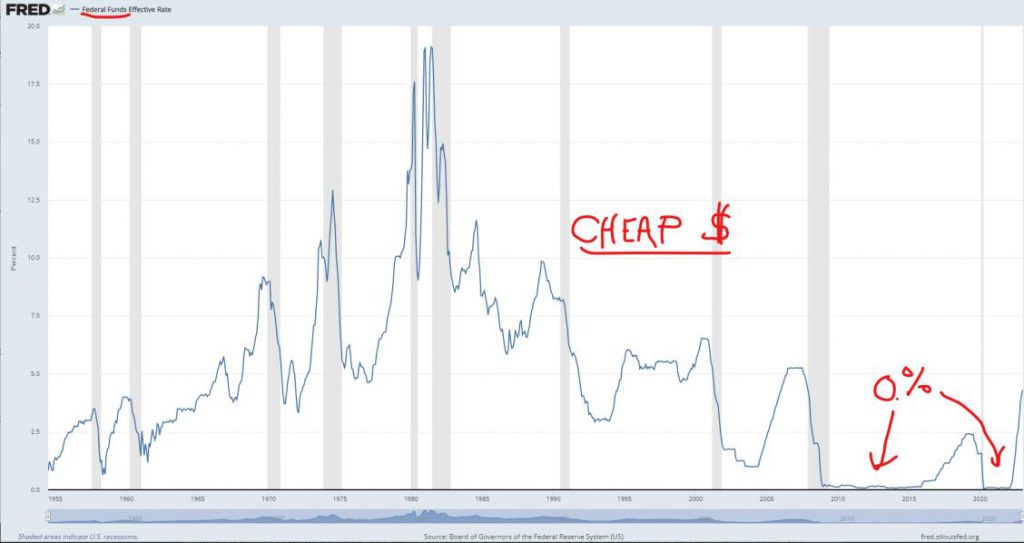
You have probably seen this chart a few times in recent years. Looking at it, one gets a clear understanding of just how extreme 0% Fed Funds looks compared to history. The pandemic recession resulted in an unprecedented steep drop to 0%, once again. You can see how that drop manifested a further bloating of corporate debt on the prior chart! While we are observing extremes. Check out how quickly Fed Funds rose in 2022. I am sure you know that by now, but it becomes more stark when you see it on a time series chart. On this very same chart you can see back in history when rates rose that quickly. It was the 1980s and inflation was a problem back then too. We also know that those extreme moves led to recessions. Today, we can justify those recessions because the breakout inflation of the late 1970s and 1980s was extinguished. But living through those recessions was certainly not fun. Not fun for consumers, and certainly not fun for heavily indebted companies.
Defaults
I am sure that it wouldn’t be a surprise to learn that debt defaults rise during recessions. Companies with diminishing sales growth are unable to generate enough cash flow to cover their debt service and some default. Check out this chart from S&P Global.
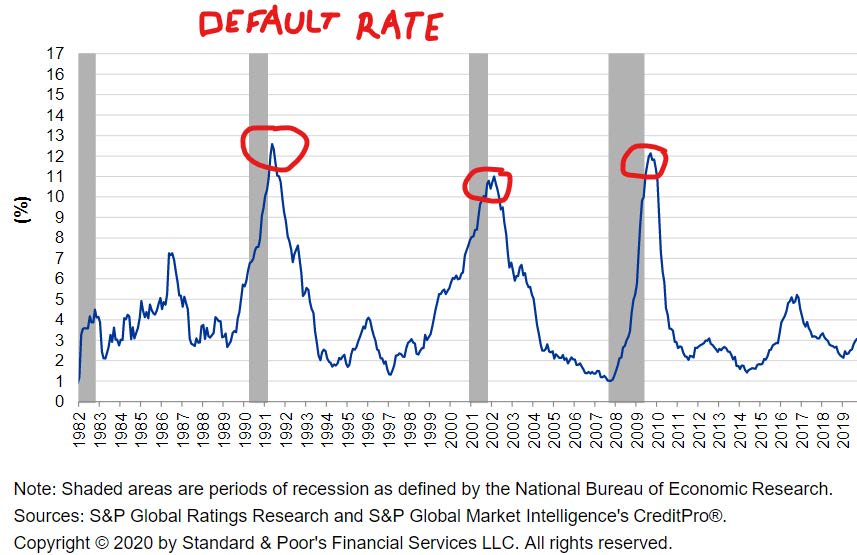
The above chart details default rates since 1982 up to the pandemic. Though a more current chart is not yet available, the important takeaway is that default rates have, in fact, increased as a result of economic recessions, the areas shaded in gray. They also get elevated during times of earnings recessions, as can be noted by the 2017 spike. Greater disaster was avoided when the Tax Cuts and Jobs Act of 2017 provided companies with much needed relief.
What is next for corporate debt?
Right now, it is clear that interest rates are likely to remain on the climb and the Fed has said as much. It is also clear that companies are facing headwinds that are likely to challenge their ability to service debt. With interest rates higher than they have been in many years, companies will struggle to not only take on new debt but will find it harder to refinance older debt. If, in fact the worst-case scenario of high interest rates and a declining economy comes to fruition, default rates are likely to grow as they have in the past. As we have learned by just eyeballing the chart at the head of this newsletter, there is a lot of debt out there. Any spike in defaults is likely to bring more pain than even in the past, as a result. The bubble will… pop. So, the prescription to avoid getting stuck in that mess is: select your bond investments carefully. To be clear, ratings agencies like Standard & Poor’s and Moody’s do a lot of legwork for you. Lower quality, speculative grade debt is more likely to run into trouble. So, while those higher yields on lower-rated paper may look appetizing, they may portend trouble in the future. The good news is that US Treasuries offer attractive yields with a low probability of default. I would say, “no” probability, but I don’t want to get into the semantics.
IMPORTANT DISCLOSURES.
Muriel Siebert & Co., LLC is an affiliated broker/dealer of the public holding company, Siebert Financial Corporation, which also owns Siebert AdvisorNXT, LLC. Siebert AdvisorNXT, LLC is a registered investments advisor (RIA) with the SEC and with state securities regulators. We may only transact business or render personal investment advice in states where we are registered, filed notice or otherwise excluded or exempted from registration requirements. Investment Advisor products are NOT insured by the FDIC, SIPC any federal government agency or Siebert’s parent company or affiliates.
You are being provided this Market Note for general informational purposes only. It is not intended to predict or guarantee the future performance of any security, market sector or the markets generally. This Market Note does not describe our investment services, recommendations or market timing nor does it constitute an offer to sell or any solicitation to buy. All investors are advised to conduct their own independent research before making a purchase decision. This Market Note is to provide general investment education and you are solely responsible for determining whether any investment, security or strategy, or any other product or service, is appropriate for you based on certain investment objectives and financial situation. Do not use the information contained in this email as a basis for investment decisions. You should always consult your investment advisor and tax professional regarding your investment situation before investing. The charts and graphs are obtained from sources believed to be reliable however Siebert AdvisorNXT does not warrant or guarantee the accuracy of the information. Any retransmission, dissemination or other use of this email is prohibited. If you are not the intended recipient, delete the email from your system and contact the sender. This is a market commentary, not research under FINRA Rule 2210 (b)(1)(D)(iii) and FINRA Rule 2210 (c)(7)(C).
© 2021 Siebert AdvisorNXT All rights reserved.
