

Stocks were off slightly yesterday with a mixed close after hawkish comments by Fed officials cooled the bullish sentiment from a day earlier. All eyes are on this morning’s monthly job number from the Bureau of Labor Statistics – investors want to know how much this technical recession is going to hurt.
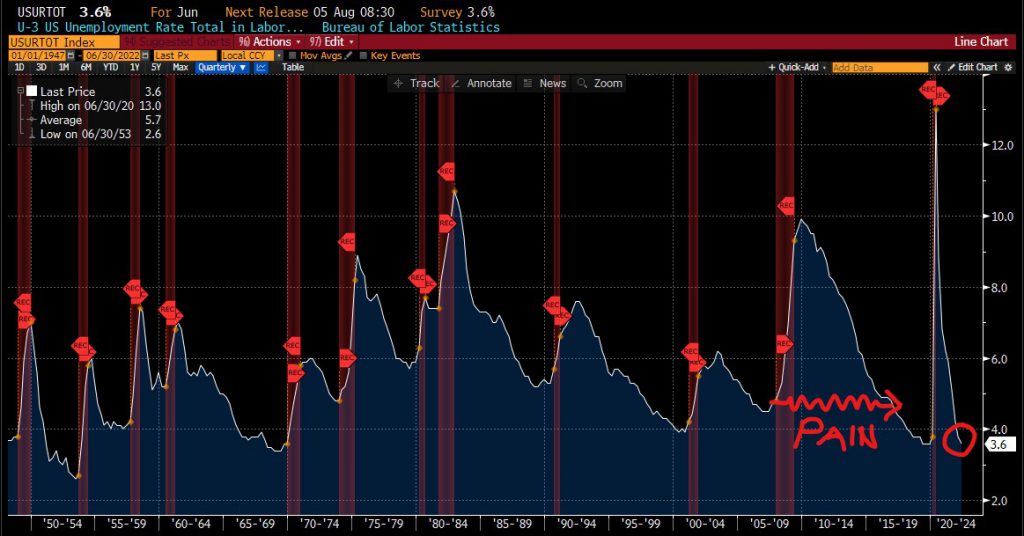
The final frontier. Well, we are finally here – it’s jobs day. On the first Friday of each month the Bureau of Labor Statistics releases its employment situation data series. In it, we find out the all-important, and highly quoted Unemployment Rate. That is, the number of unemployed citizens as a percentage of the labor force. To get slightly more specific, the popular economic number is the U-3 Unemployment Rate. It covers people who are unemployed but actively seeking work. For example, if someone became unemployed and just decided to retire and therefore not seek new employment, they would not be considered unemployed under U-3. There is actually another rate, the U-6 Unemployment Rate, that may actually provide a more realistic view of the markets. The U-6 series includes anyone seeking employment including discouraged, underemployed, as well as simply, unemployed (U-3). Discouraged jobseekers are also referred to as marginally attached (sounds bad, but you can actually catch Fed officials using the term occasionally). Marginally attached workers are people who are available and willing to work, but who have not actively sought work in the past 4 weeks but have at some point in the prior 12 months. An example of this may be someone who is unemployed, sought a job at some point in the past year, but who grew discouraged and stopped searching. This can be a real problem in a weak labor market or in a unique situation like the pandemic where a combination of COVID fears and Government Incentives caused some unemployed folks to stop searching for new jobs. An Underemployed person may be someone who is unemployed and seeking full-time employment, but for lack of one, is working part-time. The person is technically working but wishes to have full-time employment. This person would not be considered unemployed in the more popular U-3 Unemployment rate. The U-6 rate provides us with a more realistic rate of unemployment which is why so many economists – AND THE FED like to look at this series closely.
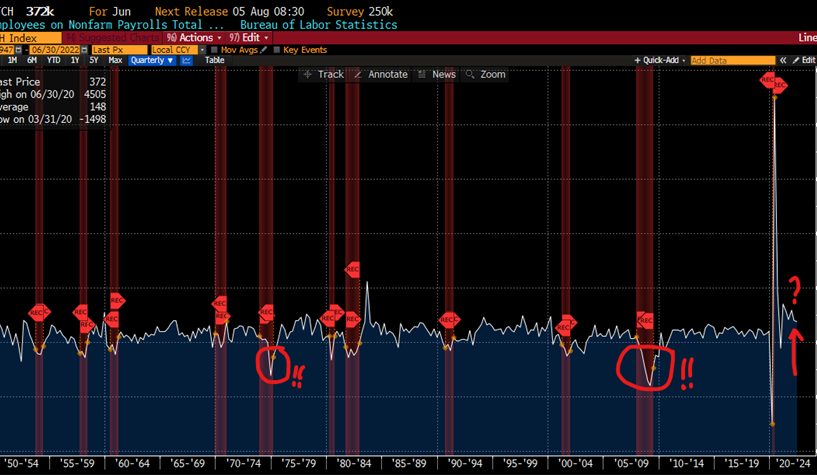
The other popular headline number in the monthly employment situation report is the Change in Non-Farm Payrolls. This is a measure of new jobs created or lost in the past month. As the name implies, farm workers are not included. That doesn’t mean that farm workers are not important, it is more likely, due to the seasonal nature of farming and its reliance of migrant workers, that those workers are excluded to minimize volatility in the statistic. In any case, the Bureau of Labor Statistics estimates that the number covers some 80% of all aggregates driving Gross Domestic Product (GDP). Also, not included in the statistic are military personal, self-employed small business proprietors, non-profit employees, private household / domestic workers, and some Government employees such as CIA, NSA, Defense Intelligence Agency, and appointed officials. Ok, so let’s just say the number covers quite a bit of the economy. Economists like to look at the monthly trend of the number. In a healthy economy, companies are constantly hiring, expanding their workforces, while conversely, in a weak economy, employers shed workers to remain profitable. If the pace of monthly hires begins to shrink, that may be a sign that the economy is losing steam. In addition, the magnitude of monthly changes is also important.
In the past few weeks, we have spoken a lot about the current technical recession in the US resulting from 2 consecutive quarterly pullbacks in GDP. If you have heard me say it once or one too many times, recession is just a word. Many folks may never even know that the country is in a recession if it was not such a hot media topic. What people do feel is unemployment. The following 2 charts show the Unemployment Rate and Change in Non-Farm Payrolls going back to 1947, including recessions (areas shaded in red). Recessions with deeper dips in monthly employment, aka larger monthly layoffs, are more painful. Likewise with the large jumps in the Unemployment Rate. We can also learn something about the length of time in which the Unemployment Rate remains elevated. An example would be The Great Recession. Unemployment jumped during the recession, but it took some 8 years for the rate to recede to its pre-recession level, leaving many people to believe that the recession lasted far longer than the 1 year and 7 months the recession actually lasted. In today’s release, we will learn about not only if the technical recession moniker will stick, but even more importantly, if we are in a recession how bad it will hurt and how long the pain may last.
YESTERDAY’S MARKETS
Stocks closed weaker yesterday ahead of today’s employment numbers and in response to hawkish Fed comments. The S&P500 slipped by -0.08%, the Dow Jones Industrial Average fell by -0.26%, the Nasdaq Composite Index gained +0.41%, and the Russell 2000 Index declined by -0.13%. Bonds rose and 10-year Treasury Note Yields fell by -1 basis point to 2.68%. Cryptos pulled back by -3.92% and Bitcoin declined by -3.49%.
NXT UP
- Change in Non-Farm Payrolls (July) is expected to show +250k new jobs added, down from last month’s +372k additions.
- Unemployment Rate (July) may have remained constant at 3.6%.
- The week ahead: Earnings season continues. Additionally, we will get the important CPI and PPI along with University of Michigan Sentiment for August. Check back on Monday for details and calendars.
IMPORTANT DISCLOSURES.
Muriel Siebert & Co., LLC is an affiliated broker/dealer of the public holding company, Siebert Financial Corporation, which also owns Siebert AdvisorNXT, LLC. Siebert AdvisorNXT, LLC is a registered investments advisor (RIA) with the SEC and with state securities regulators. We may only transact business or render personal investment advice in states where we are registered, filed notice or otherwise excluded or exempted from registration requirements. Investment Advisor products are NOT insured by the FDIC, SIPC any federal government agency or Siebert’s parent company or affiliates.
You are being provided this Market Note for general informational purposes only. It is not intended to predict or guarantee the future performance of any security, market sector or the markets generally. This Market Note does not describe our investment services, recommendations or market timing nor does it constitute an offer to sell or any solicitation to buy. All investors are advised to conduct their own independent research before making a purchase decision. This Market Note is to provide general investment education and you are solely responsible for determining whether any investment, security or strategy, or any other product or service, is appropriate for you based on certain investment objectives and financial situation. Do not use the information contained in this email as a basis for investment decisions. You should always consult your investment advisor and tax professional regarding your investment situation before investing. The charts and graphs are obtained from sources believed to be reliable however Siebert AdvisorNXT does not warrant or guarantee the accuracy of the information. Any retransmission, dissemination or other use of this email is prohibited. If you are not the intended recipient, delete the email from your system and contact the sender. This is a market commentary, not research under FINRA Rule 2210 (b)(1)(D)(iii) and FINRA Rule 2210 (c)(7)(C).
© 2021 Siebert AdvisorNXT All rights reserved.
