

Stocks rallied yesterday on strong economic data and applauded Speaker Pelosi’s departure from Taiwan. Despite bond market jitters some economic data is holding up…how long that will last is anyone’s guess.
Trapped by bears. I am sure that you have noticed that stocks have been on the climb lately. Of course, not every day, but it does feel like there are at least some investors willing to jump in and buy on weakness. You know that comfortable feeling that we all grew to know and love for these past many years through thick and thin. It is human nature to celebrate the return of that bullish feeling. It is also human nature to avoid the gaze of the bears on the wing. Trust me, they are there, and they are getting hungry.
The bull thesis is simple. The economy is losing steam as a result of rampant inflation and tightening monetary conditions. Because of this, the Fed may slow down, or stop altogether, hiking interest rates. That means shackles off for all those widely held, deeply loved, mega cap tech stocks and once-high-flying growth plays. The rest of the market will just follow those higher.
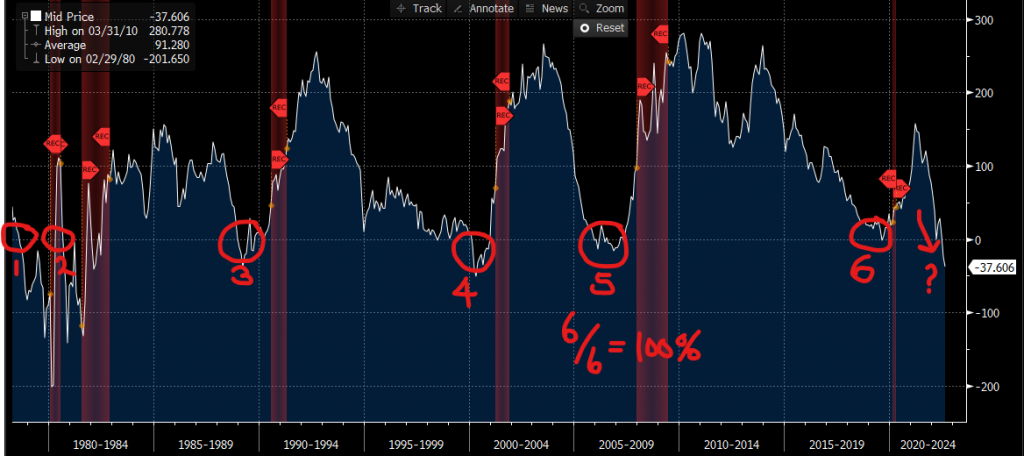
The bear case is much more complex, and unfortunately, has far more supporting data. Let’s start with one of the simplest, time proven bits of evidence, the yield curve. I have written many volumes on this topic, but I will try to keep this simple. The Fed controls the front end (short maturities) of the treasury yield curve. The longer back end of the curve (longer maturities) is controlled by traders and investors. So, shorter maturity yields go up when the Fed is hiking rates, and vice versa. Longer maturity yields go higher when a strong economy is expected. Strong economies bring high inflation and higher interest rates. Those higher rates compensate investors for the high inflation. When trouble is expected, longer maturity yields come down as investors rush to buy Treasuries as a safe harbor investment. That increased demand pushes prices higher and yields lower. The simplest way to calculate the yield curve is subtract 2-year Treasury Note yields from 10-year Treasury Note yields. During normal times, investors get higher yields on longer maturities as they are paid a premium for duration risk. So, when the Fed is raising key lending rates (or holding them steady) while investors are perceiving economic struggles ahead, that spread (or curve) between 10-year and 2-year yields narrows (or flattens). In some cases, the curve inverts. That mean yields on 2-year Notes are higher than 10-year notes. That goes against nature. How can you be compensated more for a short-term risk over a longer term one? More importantly, an inverted yield curve predated every one of the past 10 recessions! Go ahead and re-read that. Many market strategists believe the inverted yield curve to be the strongest indicator of an impending recession. To be clear the inverted curve does not cause a recession, it simply reflects the conditions that lead to one…and it has in 10 out of the past 10 recessions. Want to know where that yield curve is today? It is solidly inverted at -37 basis points after falling into negative territory in early July. Now, there are many factors that lead to a recession, so one cannot rely on the inverted yield curve alone, but a flattening curve leading to an inverted one is certainly a sign of economic weakness. Just check out the following chart which shows the curve through the past 6 recessions since 1980.
About those other factors. Those are a bit mixed at the moment. Consumer sentiment is a big one and it shows that consumers are losing confidence which is a factor that leads to a shrinking economy. Oh wait…aren’t we in a technical recession? We just had 2 consecutive quarters of declining GDP. NBER hasn’t called it an official recession yet, but they will monitor things over the next several months and make a pronouncement later this year. The latest reads of inflation still have the US at multi-decade highs, showing no strong signs of retreat. We are in the thick of earnings season and the results from Q2 have so far been solid. Earnings growth is slowing, but it is still growing. More and more companies are lowering future guidance and admitting to cost cutting measures to prepare for a potential economic pullback. If those measures lead to job cuts, we could end up in a painful recession. Job losses always lead to lower consumption which means lower revenues and earnings. Those lead to lower stock prices.
I will leave it to you to decide which case is more persuasive. Both have merit and both can co-exist…for a while, but one ultimately wins out. Then, and only then will we know if this recent surge in stocks is the beginning of a race back to new highs or a bear market rally. Caution and diligence are still the prescription. Fly steady and never ignore the bears on the wing, lest you fly straight into a bear trap.
WHAT’S SHAKIN’
Albemarle Corp (ALB) shares are higher by +5.83% after the company announced that it beat EPS and Revenue estimates by +14.06% and +3.61% respectively. The company also raised its full year guidance to well-above analyst estimates citing strong demand for lithium, a key ingredient in battery production. Dividend yield: 0.65%. Potential average analyst target upside: +17.1%.
Eli Lilly & Co (LLY) shares are lower by -3.77% in the premarket after the company announced that it missed EPS and Revenue targets by -25.88% and -4.93%. The company lowered its full year EPS guidance but reiterated earlier sales estimates. Dividend yield: 1.24%. Potential average analyst target upside: +6.5%.
ALSO, this morning: Air Products and Chemicals (APD), Cigna (CI), EPAM Systems (EPAM), NRG Energy (NRG), Sempra Energy (SRE), and Duke Energy (DUK) all beat on EPS and Revenues. YETI Holdings (YETI) and WeWork (WE) came up short on both.
YESTERDAY’S MARKETS
Stocks rallied yesterday on stronger than expected economic numbers. The S&P500 gained +1.56%, the Dow Jones Industrial Average climbed by +1.29%, the Nasdaq Composite Index rose by +2.59%, and the Russell 2000 Index advanced by +1.41%. Bonds gained and 10-year Treasury Note yields fell by -4 basis points to 2.70%. Cryptos added +1.59% and Bitcoin rallied by +1.29%.
NXT UP
- Initial Jobless Claims (July 30) is expected to come in at 260k, up slightly from last week’s 256k claims.
- Trade Balance (June) The trade deficit may have narrowed slightly to -$80.0 billion from -$85.0 billion.
- After the closing bell earnings: Block Inc, DoorDash, fuboTV, NortonLifeLock, Zillow, Vertex Pharmaceuticals, Monster Beverage, Dropbox, Codexis, Public Storage, Twilio, Warner Brothers Discover, Beyond Meat, Live Nation Entertainment, Rocket Cos, Expedia Group, Redfin, HubSpot, AMC Entertainment, Cloudflare, Lyft, and Figs.
IMPORTANT DISCLOSURES.
Muriel Siebert & Co., LLC is an affiliated broker/dealer of the public holding company, Siebert Financial Corporation, which also owns Siebert AdvisorNXT, LLC. Siebert AdvisorNXT, LLC is a registered investments advisor (RIA) with the SEC and with state securities regulators. We may only transact business or render personal investment advice in states where we are registered, filed notice or otherwise excluded or exempted from registration requirements. Investment Advisor products are NOT insured by the FDIC, SIPC any federal government agency or Siebert’s parent company or affiliates.
You are being provided this Market Note for general informational purposes only. It is not intended to predict or guarantee the future performance of any security, market sector or the markets generally. This Market Note does not describe our investment services, recommendations or market timing nor does it constitute an offer to sell or any solicitation to buy. All investors are advised to conduct their own independent research before making a purchase decision. This Market Note is to provide general investment education and you are solely responsible for determining whether any investment, security or strategy, or any other product or service, is appropriate for you based on certain investment objectives and financial situation. Do not use the information contained in this email as a basis for investment decisions. You should always consult your investment advisor and tax professional regarding your investment situation before investing. The charts and graphs are obtained from sources believed to be reliable however Siebert AdvisorNXT does not warrant or guarantee the accuracy of the information. Any retransmission, dissemination or other use of this email is prohibited. If you are not the intended recipient, delete the email from your system and contact the sender. This is a market commentary, not research under FINRA Rule 2210 (b)(1)(D)(iii) and FINRA Rule 2210 (c)(7)(C).
© 2021 Siebert AdvisorNXT All rights reserved.
