
Have you traveled outside of the US in the past several years? If you have, you might have observed that there is a noticeable difference in the state of infrastructure in the country you visited compared to that of the US. You may have actually been surprised, if not disappointed. After all, the US boasts the largest economy in the World. So how is it, you wonder, can a country that is so rich, have an infrastructure that is so… well, poor? Now, I know that I am generalizing. Depending on where you reside in the US, your experience may be somewhat different. I am not biased, but I am going to use NYC as my qualitative baseline, not just because that is where I am from, but because most of you have probably either visited the city, or you have seen it on TV. NYC’s GDP is around $19.5 trillion! Compare that to Sydney Australia which has a GDP of around $550 billion, representing roughly 1/3 of Australia’s GDP. That’s right, New York City’s GDP is larger than Australia’s entire GDP. Imagine that!
Imagine this, if you will
Imagine standing on a NYC subway platform in the middle of the summer. I won’t even begin to describe the unique perfume (that is a nice way of saying smell) of the poorly circulating air. That aside, you are likely to notice that the lighting is poor, tiles are randomly missing, there is sparse signage, and the trains … are rarely on time. Don’t get me wrong, the subway is the most cost effective and efficient way to get around the city and riding it can be entertaining, but how can it be in such a poor state of affairs? New York is the richest city in the world! Ok, I will stop picking on the subways. How about the roads and bridges? Have you ever seen a New York pothole? You better get tire insurance. Perhaps you have traveled through LaGuardia Airport en route to your final destination. You might wonder how an airport of that size can serve a city with so many inhabitants. Alright, alright, I am sure that you got the message, as I am sure that you are well aware of the fact that the country is in need of some infrastructure investment.
A picture is worth a thousand words
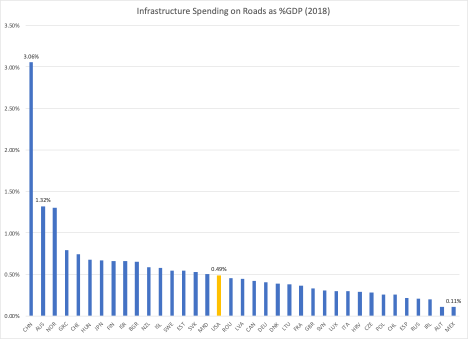
The following chart details infrastructure spending, specifically on roads, as a percent of Gross Domestic Product (GDP) for the year of 2018. China spends the most coming in at 3.06% while Mexico spends the least with 0.11%. The United States, which spends 0.46% , is roughly in the middle of the pack and slightly higher than the median of 0.44%. Remember Sydney, Australia from my example up above? It is the second biggest spender, doling out some 1.32% of its GDP for roads.
More than just roads
When we think of infrastructure, we instantly think of roads, rails, tunnels, and bridges, but there is far more involved. Infrastructure can include public water supply, energy generation, the power grid, and the new kid on the block: broadband. It can also include airports, parks, and other public spaces. All of these things not only add to quality of life for Americans, but they are also necessary for the country to thrive and remain competitive on the world stage. Let’s take a quick look at what is considered the forebearer of infrastructure investment: The New Deal.
Such a deal
Many of us know about The New Deal as being the cornerstone of President Franklin D. Roosevelt’s post-depression economic recovery. There were actually 2 New Deals! Both came in the wake of the Great Depression which lasted from August 1929 through March 1933. It was designed to focus on:
- Relief for the unemployed
- Financial reform
- Economic recovery
The Great Depression not only caused severe economic hardship, but also exposed weaknesses in the banking system social infrastructure programs. The first New Deal began in 1933 and focused on banking reform and the beginnings of the public works programs as well as rural development programs. The famous Tennessee Valley Authority (TVA) was created in the first New Deal, and still exists today. The second New Deal came to life in 1935 and included the Works Progress Administration (WPA), which is noted for the creation of the 650,000 miles of roads and some 125,000 public buildings.
It is important to note that The New Deal, in its entirety, covered far more than the infrastructure projects we are discussing today. Some notable programs are:
- The Tennessee Valley Authority
- Federal Deposit Insurance Program (FDIC)
- Glass-Steagall Act (investment banking regulation)
- Securities Act of 1933
- Social Securities Act
- Fair Labor Standards Act
There were many more, and these aforementioned still exist today.
Notable infrastructure projects
When we think of The New Deal, images of workers lining highways, climbing poles, climbing mountains, manning steam shovels, and wielding pick axes are conjured up. Some of the most notable infrastructure projects that resulted from The New Deal are:
- The Hoover Dam
- Pennsylvania Railway Electrification between NYC and Washington DC
- LaGuardia Airport in NYC
- The Bay Bridge In San Francisco
- The Lincoln Tunnel in NYC
- The Tri-Borough Bridge in NYC
- The Grand Coulee Dam in Washington
- The Overseas Highway in Florida
The Public Works Authority (PWA), part of the first New Deal, spent $3.3 billion on roughly 34,000 projects. The Works Progress Administration (WPA) , part of the second New Deal, is credited with employing nearly 8.5 million workers with an initial budget of $4.9 billion. As you might guess there was and still is plenty of controversy around some of the more socially-oriented programs, however The New Deal, unarguably helped to stimulate the economy in the post Great Depression years and yielded many public works projects, which are still in use today… which brings us back to today and our needy infrastructure.
Today’s dollars
Infrastructure spending is one of those things that is recognized as being both necessary as well as economically stimulating, but unfortunately, it has not gotten the political attention required to pass legislation. More recently however, popular support has been mounting for an infrastructure reboot due to increasing security threats on outdated infrastructure, increasing economic competition from trading partners, and increasing reliance on broadband infrastructure. Rightly so, the Trump Administration made infrastructure a priority and began the political process to enact legislation but was unfortunately sidetracked by politics, mid-term elections, a trade war with China, and ultimately the COVID-19 crisis. The prior administration’s legwork however, did not go to waste and it paved the way for the Biden Administration to bring it front and center once again. President Biden is in a fortunate position in that he enjoys a Democratic House and Senate as well as a mandate to stimulate economic growth in the wake of the pandemic-led recession.
Aim high
President Biden’s initial infrastructure plan proposal was for roughly $2.25 trillion to be spent on traditional infrastructure projects along with some socially-oriented projects. The roughly $500 billion circled for socially-oriented projects was largely focused on “workforce development”, care for aging/disabled, early development, and education, and was ultimately removed from the bigger package to be introduced under separate legislation. That leaves the balance of the proposal focused on what has been termed as “hard infrastructure.” After much deliberation Biden announced last week that a deal had been struck between the White House and a group of bipartisan Senators. The much whittled-down deal includes $1.2 trillion in spending over the next 8 years. The costs would include $579 million in new spending with the balance presumably coming from existing allocations. At a high level the deal includes:
- Public transportation – $156 billion to be spent on railroads (e.g. Amtrack), public transit, airports, and sea ports.
- Road, Bridges, Tunnels – $109 billion.
- Electric grid and water distribution – $128 billion will go to updating power grid along with the removal of lead pipes.
- Broadband infrastructure – $65 billion.
- Electronic Vehicles – $15 billion to be spent on electric vehicle charging networks and converting public transportation vehicles.
The deal will still have to be voted on by the Senate and House and there is still some negotiating that has to be undergone to determine how the spending will be paid for. However it does appear to have the necessary support to get through in one form or another.
Impact on portfolios
As one might suspect the announcement that the Government is going to spend hundreds of billions of extra dollars has caught the attention of investors. Companies that are involved in industrial machinery, materials, engineering, services, construction management, and infrastructure stand to benefit from the increase in spending. Most of the companies fall squarely in the Industrial and Materials sectors. Additionally, spending on broadband infrastructure is likely to benefit companies in the Information Technologies sector. Before you run out and buy your favorite companies in those sectors it is important to note that many investors have been anticipating an infrastructure deal even prior to the Presidential election which has served to push valuations higher in those sectors. Many of those stocks have recently rallied along with cyclical value stocks as the economy has shown signs of recovery. The bottom line is that many companies stand to benefit from the expected increased infrastructure spending over the next 8 years, but many of them may be fully (or as we say on Wall Street “fairly”) valued. Further, it should be noted that while the political winds favor the spending today, political support can change in the years ahead.
The newest, new deal
So, here we are with what looks to be a historic infrastructure deal which should serve to heal our ailing infrastructure and provide much needed jobs and investments into our recovering economy. Sound familiar? The New Deal cost an estimated $41.7 billion dollars which would be equivalent to around $819 billion today. If we separate out the “hard infrastructure” programs from the PWA and WPA, whose budgets were around $8.2 billion, those would cost us $161 billion in 2021 dollars, far less than the currently agreed upon $579 billion plan. Further, if we separate out the spending allocated for roads, bridges, and tunnels ($109 billion) and add it to the amount spent in 2018, that would bring spending up to 1.02% GDP… which would still put us lower than Australia in the chart up above. The Sydney Metro is fully air conditioned and the trains are completely automated, which means that they are driverless. I am not sure I would want to be on a New York City Subway train without a driver, but I certainly wouldn’t mind some air conditioning.
IMPORTANT DISCLOSURES.
Muriel Siebert & Co., LLC is an affiliated broker/dealer of the public holding company, Siebert Financial Corporation, which also owns Siebert AdvisorNXT, LLC. Siebert AdvisorNXT, LLC is a registered investments advisor (RIA) with the SEC and with state securities regulators. We may only transact business or render personal investment advice in states where we are registered, filed notice or otherwise excluded or exempted from registration requirements. Investment Advisor products are NOT insured by the FDIC, SIPC any federal government agency or Siebert’s parent company or affiliates.
You are being provided this Market Note for general informational purposes only. It is not intended to predict or guarantee the future performance of any security, market sector or the markets generally. This Market Note does not describe our investment services, recommendations or market timing nor does it constitute an offer to sell or any solicitation to buy. All investors are advised to conduct their own independent research before making a purchase decision. This Market Note is to provide general investment education and you are solely responsible for determining whether any investment, security or strategy, or any other product or service, is appropriate for you based on certain investment objectives and financial situation. Do not use the information contained in this email as a basis for investment decisions. You should always consult your investment advisor and tax professional regarding your investment situation before investing. The charts and graphs are obtained from sources believed to be reliable however Siebert AdvisorNXT does not warrant or guarantee the accuracy of the information. Any retransmission, dissemination or other use of this email is prohibited. If you are not the intended recipient, delete the email from your system and contact the sender. This is a market commentary, not research under FINRA Rule 2210 (b)(1)(D)(iii) and FINRA Rule 2210 (c)(7)(C).
© 2021 Siebert AdvisorNXT All rights reserved.
